> ## Documentation Index
> Fetch the complete documentation index at: https://docs.cloud.vessl.ai/llms.txt
> Use this file to discover all available pages before exploring further.
# Monitor inference status
> Track token usage, cost breakdown, performance, and reliability for each model under contract.
Once your API key is active, two places show your numbers: the **Usage summary** card on each model page, which defaults to the current month, and the **Monitoring Dashboard**, opened from **Monitoring** under **Inference** in the sidebar, which tracks token usage, performance, and reliability over a date range you pick.
Use the demo below to see how to open the **Monitoring Dashboard** from a model page and read the metrics under each tab.
## Usage summary
This card sits on the model page. Use the month picker at the top of the card to move between billing months, and **View details in Monitoring** to open the Monitoring Dashboard.
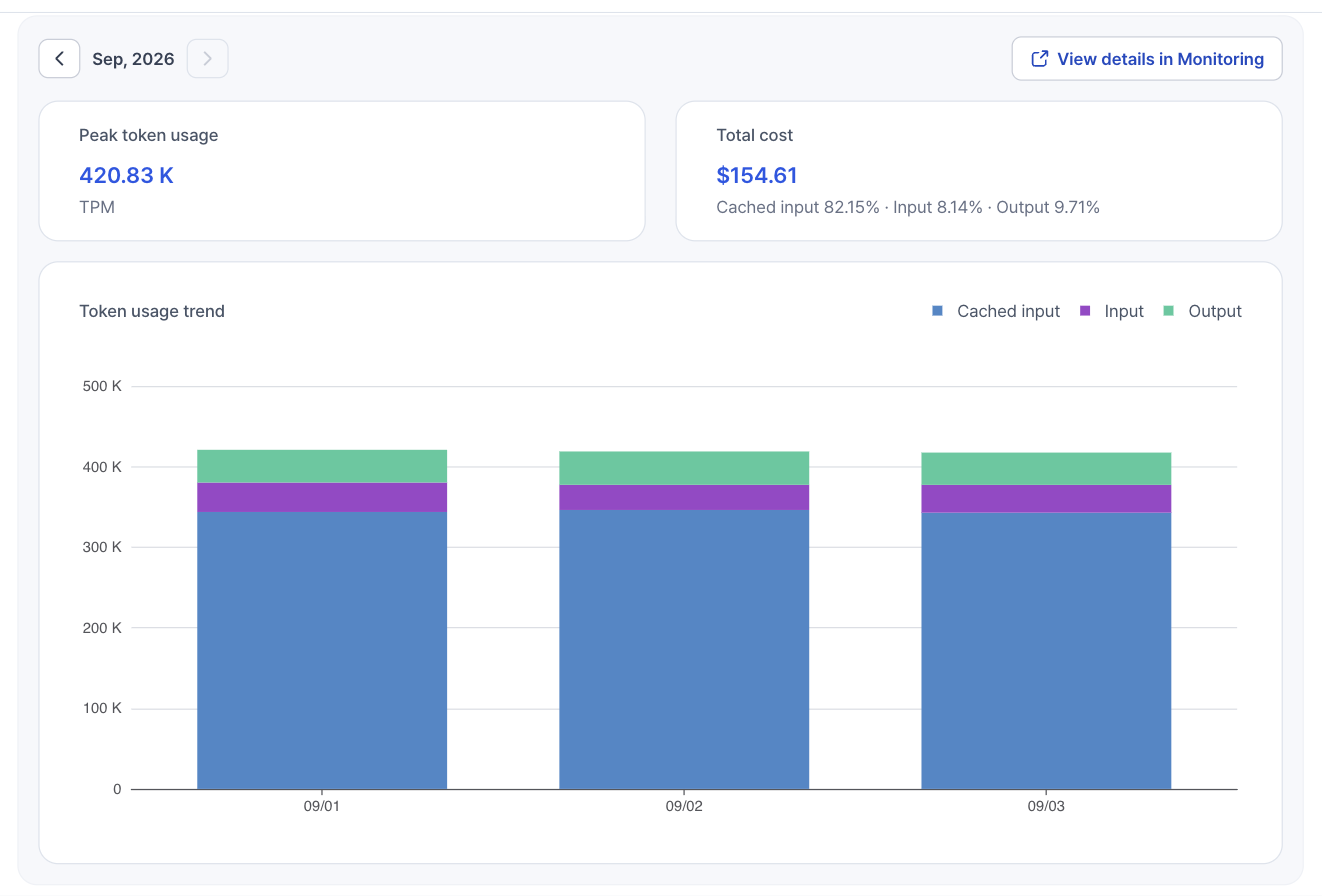 Example: one month of usage on a model under contract
| | |
| --------------------- | ---------------------------------------------------------------------------------------------------------------------------------------------------------------------------------------------------------------------------------------------------------------- |
| **Peak token usage** | The highest throughput reached in the month, in tokens per minute (TPM). Compare it with the capacity your contracted Provisioned Throughput Units (PTUs) guarantee to see how much headroom you have. |
| **Total cost** | The month's usage priced at the model's per-token rates, with the share of cached input, input (uncached), and output tokens. Under a Provisioned Throughput contract you pay for the PTUs you reserve, so read this as a usage figure rather than your invoice. |
| **Token usage trend** | Daily token usage, stacked by cached input, input (uncached), and output. Hover a bar for that day's exact numbers. |
## Monitoring Dashboard
Open **Inference** → **Monitoring** in the sidebar, or click **View details in Monitoring** on a model page. Pick a date range and one model or all of them, then read the metrics under three tabs.
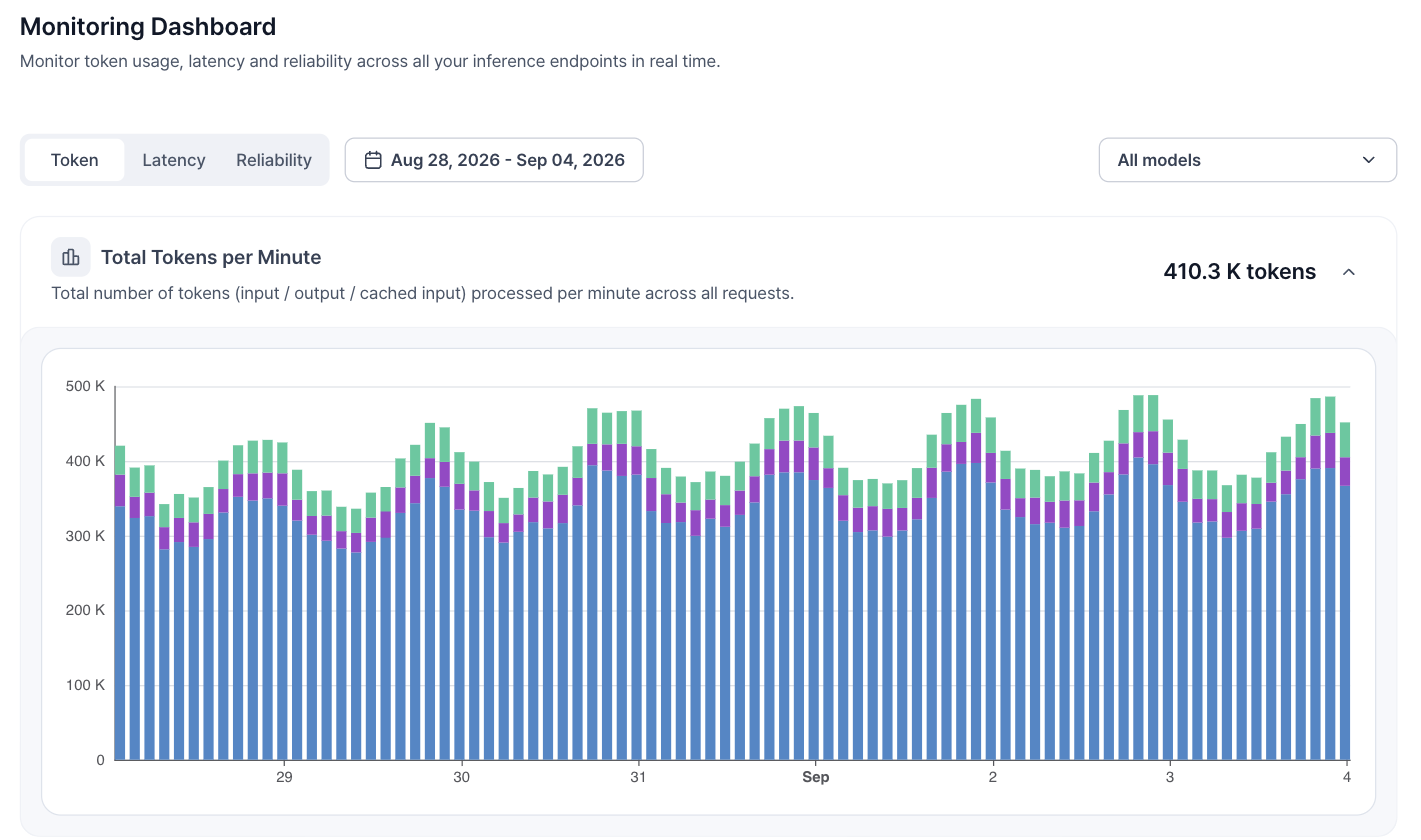 Example: token usage across all models over a one-week range
| | |
| --------------- | -------------------------------------------------------------------------------------------------------------------------------------------------- |
| **Token** | Tokens per minute, split into total, input, and output. |
| **Performance** | Time to first token (TTFT) and time per output token (TPOT), each at p50, p90, and p99, alongside per-request generation speed and cache hit rate. |
| **Reliability** | Requests per minute, and the share of requests that failed with a 4xx or 5xx error. |
## When you need more capacity
If **Peak token usage** is approaching the capacity your contracted PTUs guarantee, add PTUs: [talk to sales](https://vessl.ai/en/talk-to-sales?utm_source=docs\&utm_medium=referral\&utm_campaign=inference_en\&utm_content=monitor_more_capacity) or click **Need more capacity?** on the model page. See [Manage your contract](/inference/contracts).