> ## Documentation Index
> Fetch the complete documentation index at: https://docs.cloud.vessl.ai/llms.txt
> Use this file to discover all available pages before exploring further.
# 인퍼런스 상태 모니터링하기
> 계약 중인 모델별로 토큰 사용량, 비용 구성, 성능, 안정성을 확인하는 방법을 안내해요.
API Key가 활성화되면 두 곳에서 수치를 볼 수 있어요. 하나는 각 모델 페이지에 있는 Usage summary 카드(기본값은 이번 달)이고, 다른 하나는 사이드바 **Inference** → Monitoring으로 여는 Monitoring Dashboard예요. 대시보드에서는 선택한 기간의 토큰 사용량, 성능(performance), 안정성(reliability)을 파악할 수 있어요.
아래 데모에서 모델 페이지를 열고 Monitoring Dashboard로 넘어가 탭별로 지표를 확인하는 과정을 볼 수 있어요.
## Usage summary
모델 페이지에 있는 카드예요. 카드 상단의 월 선택기로 다른 정산 월로 이동하고, View details in Monitoring으로 Monitoring Dashboard를 열 수 있어요.
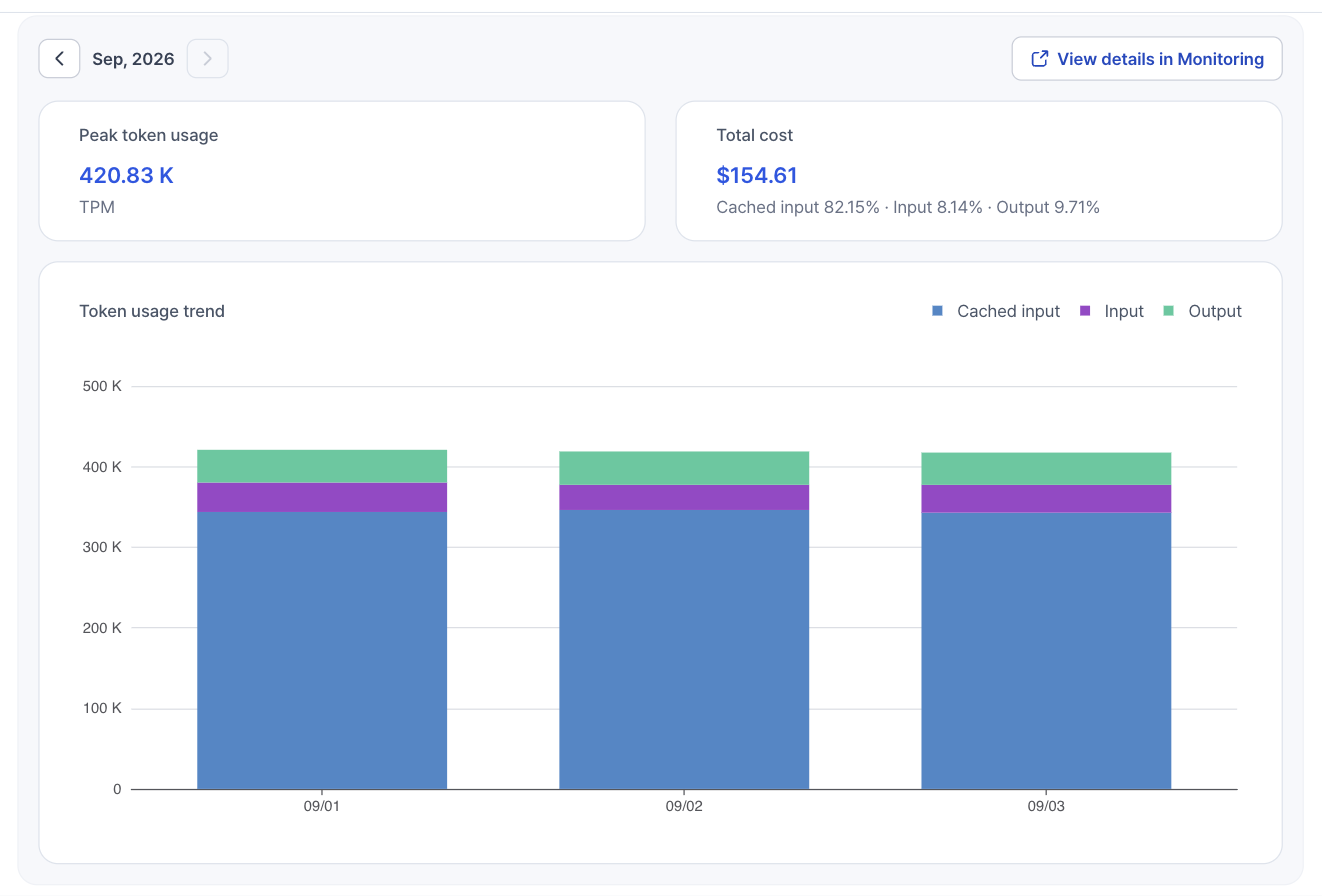 예시: 계약 중인 모델의 한 달 사용량
| | |
| --------------------- | ----------------------------------------------------------------------------------------------------------------------------------------------------------------------------------------- |
| **Peak token usage** | 해당 월에 도달한 최고 처리량(분당 토큰 수, TPM)이에요. 계약한 PTU(Provisioned Throughput Unit)가 보장하는 용량과 비교하면 얼마나 여유가 있는지 알 수 있어요. |
| **Total cost** | 해당 월 사용량을 모델의 토큰 단가로 환산한 금액이에요. 캐시된 입력(Cached input), 캐시되지 않은 입력(Input), 출력(Output)이 각각 얼마나 차지하는지도 함께 보여줘요. Provisioned Throughput은 예약한 PTU를 기준으로 과금되기 때문에, 청구서가 아니라 사용량을 가늠하는 수치로 봐 주세요. |
| **Token usage trend** | 일별 토큰 사용량을 캐시된 입력, 캐시되지 않은 입력, 출력으로 나눠 누적 막대로 보여줘요. 막대에 마우스를 올리면 그날의 정확한 수치를 볼 수 있어요. |
## Monitoring Dashboard
사이드바에서 **Inference** → Monitoring을 열거나 모델 페이지에서 View details in Monitoring을 클릭하세요. 기간과 모델(또는 전체)을 고르면 세 개의 탭에서 지표를 볼 수 있어요.
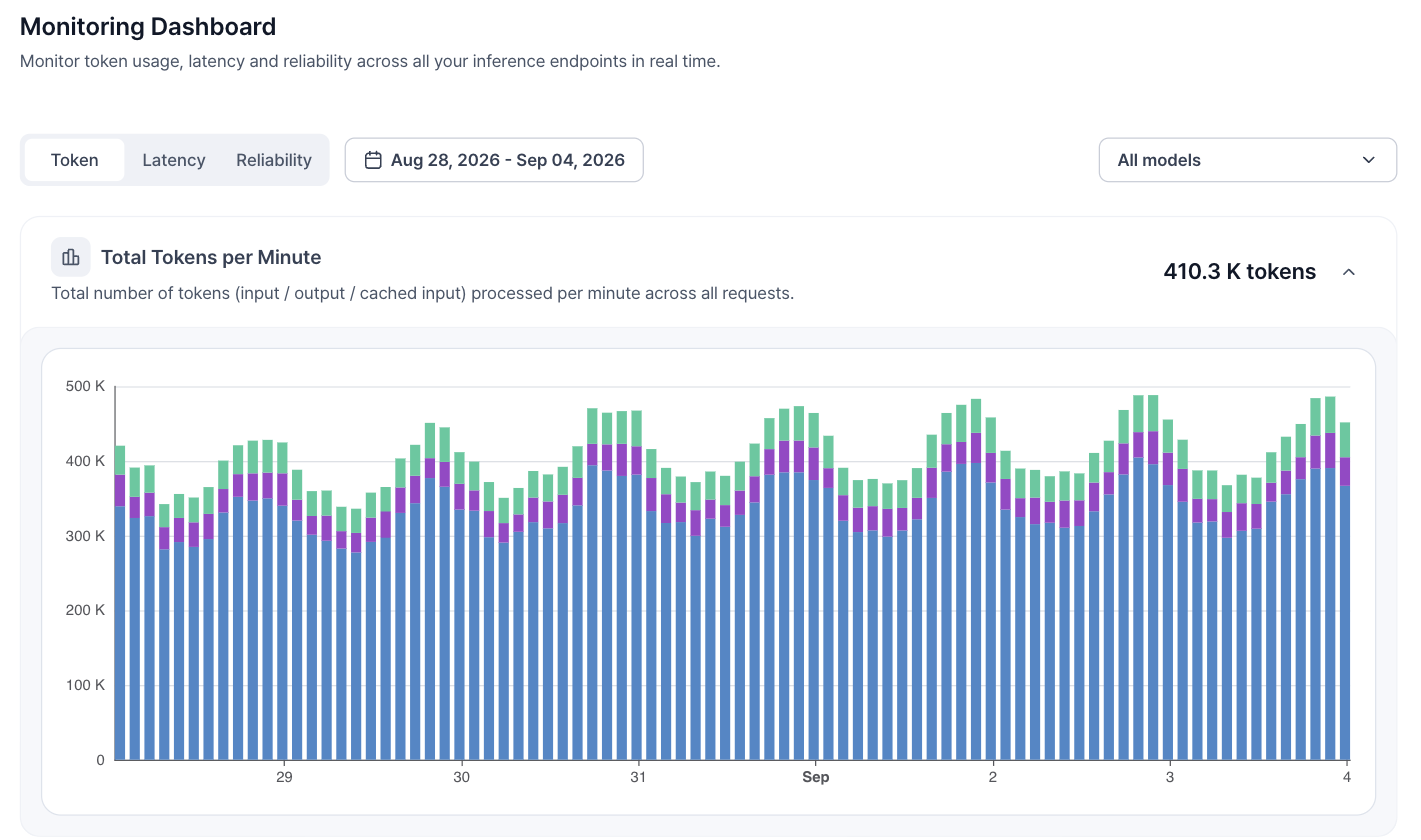 예시: 일주일 기간의 전체 모델 토큰 사용량
| | |
| --------------- | ----------------------------------------------------------------------------------------------------------------- |
| **Token** | 분당 토큰 수를 전체, 입력, 출력으로 나눠 보여줘요. |
| **Performance** | 첫 토큰까지 걸리는 시간(TTFT)과 출력 토큰 하나당 시간(TPOT)을 각각 p50, p90, p99로 보여주고, 요청당 생성 속도와 캐시 적중률(cache hit rate)도 함께 확인할 수 있어요. |
| **Reliability** | 분당 요청 수와 4xx, 5xx 오류로 실패한 요청의 비율을 보여줘요. |
## 용량 추가가 필요할 때
Peak token usage가 보장 용량에 가까워졌다면 PTU를 추가하세요. [세일즈팀에 문의](https://vessl.ai/ko/talk-to-sales?utm_source=docs\&utm_medium=referral\&utm_campaign=inference_kr\&utm_content=monitor_more_capacity)하거나 모델 페이지에서 Need more capacity?를 클릭하세요. [계약 관리하기](/ko/inference/contracts)를 참고하세요.