> ## Documentation Index
> Fetch the complete documentation index at: https://docs.cloud.vessl.ai/llms.txt
> Use this file to discover all available pages before exploring further.

# Workspace 상세 보기

> 컴퓨팅 사양, 비용, 이미지, 연결된 저장소 정보를 자세히 확인해 보세요.
<div>
  <Frame>
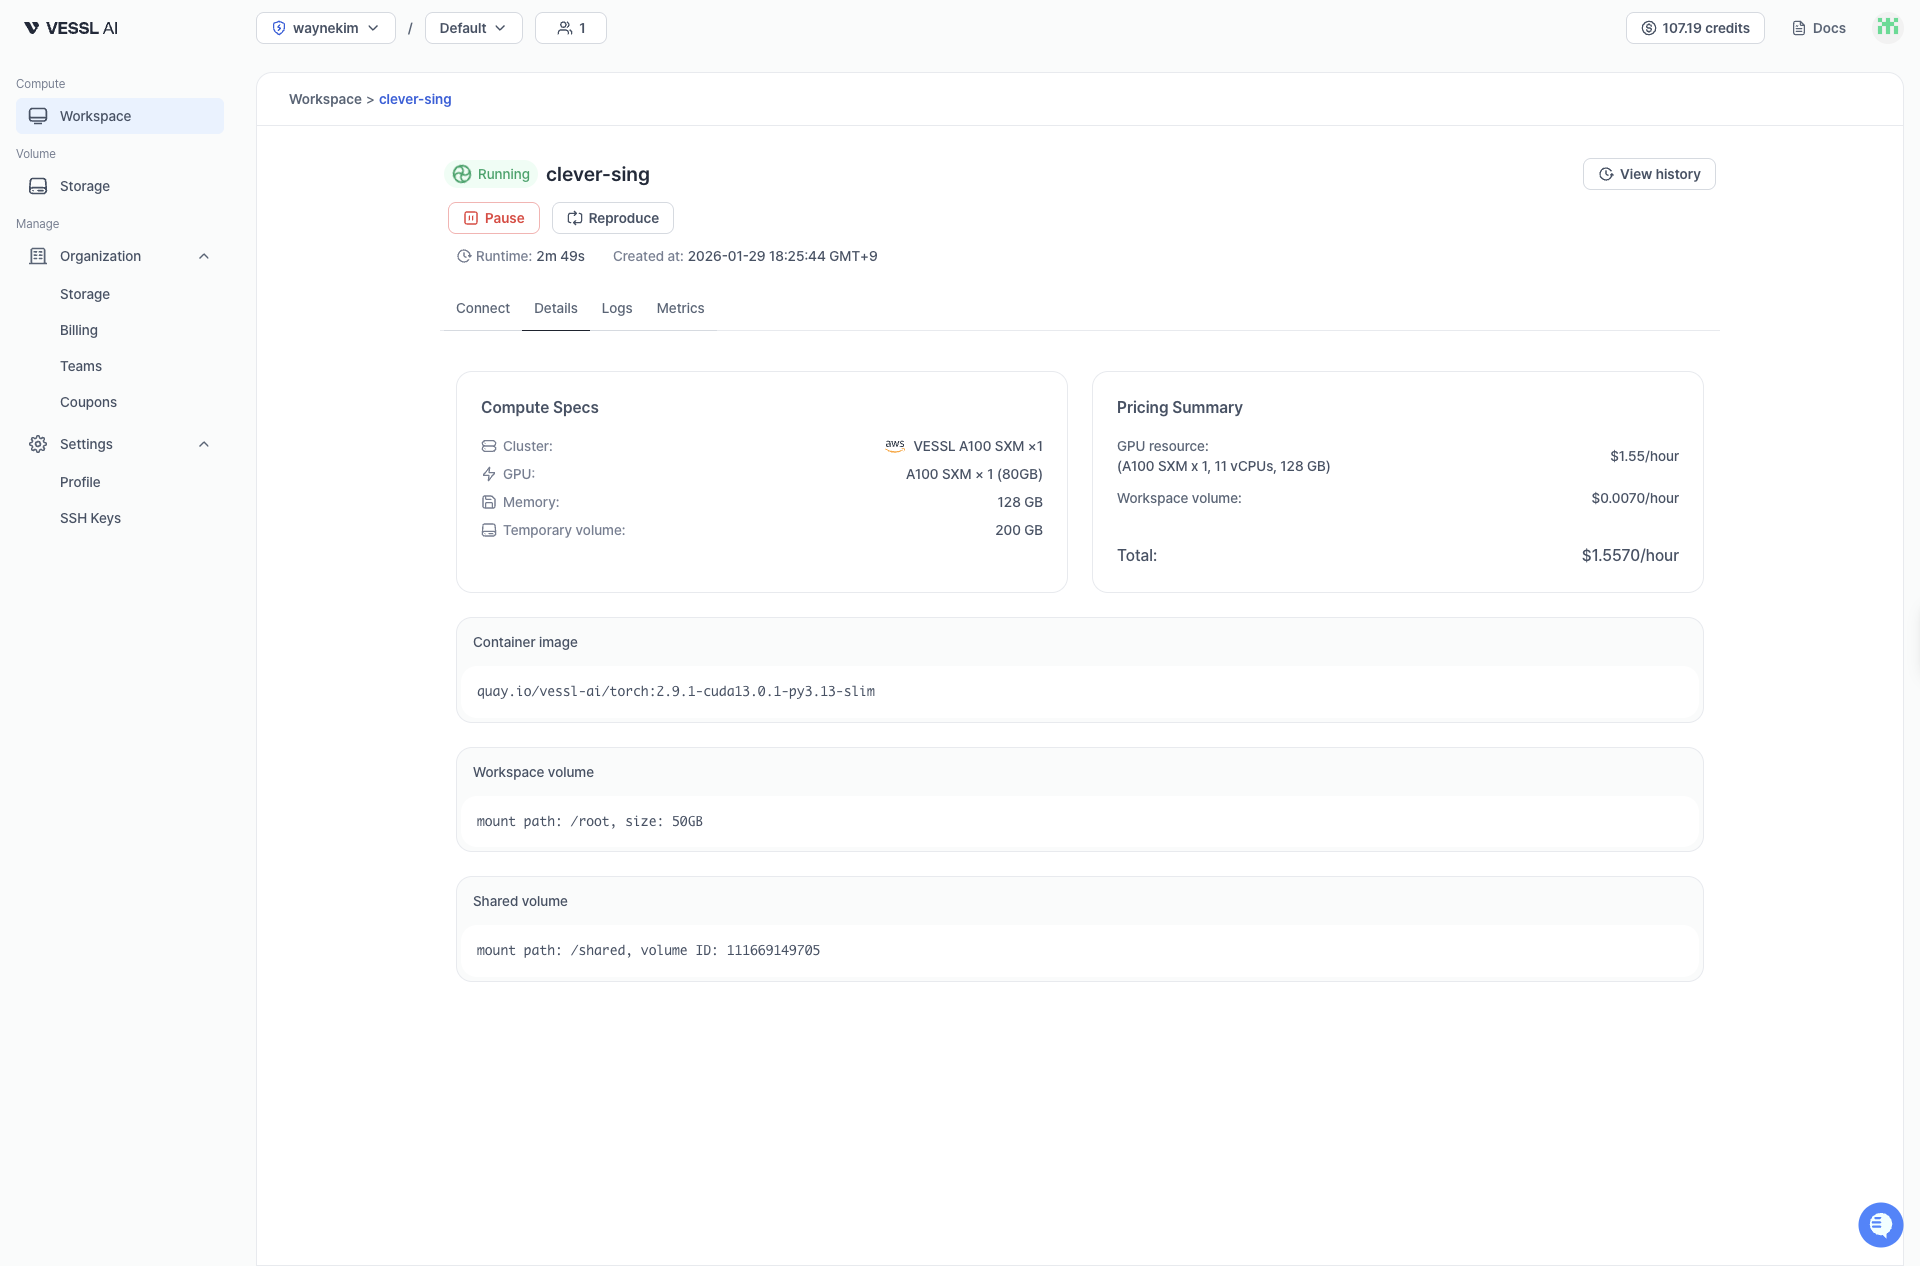
    <img src="https://mintcdn.com/dora/vPFagCAoutrvcxVV/images/newworkspacedetails.png?fit=max&auto=format&n=vPFagCAoutrvcxVV&q=85&s=7b9c462a11197a9157f56909b98fd73a" alt="Compute specs, Pricing summary, Container image, 스토리지 섹션이 보이는 Workspace 상세 페이지" width="1920" height="1266" data-path="images/newworkspacedetails.png" />
  </Frame>

  <small>예시: Workspace 상세 화면</small>
</div>

<Info>
  상세 페이지에는 다음 항목들이 표시돼요:

  * **Compute specs**: 클러스터, GPU, CPU, 메모리, Temporary storage 크기
  * **Pricing summary**: 시간당 GPU 비용과 스토리지 비용
  * **Container image**: Workspace에서 실행 중인 Docker 이미지
  * **Cluster storage**: Cluster storage 볼륨의 마운트 경로와 용량
  * **Object storage**: Object storage 볼륨과 마운트 경로 목록
</Info>

<Note>
  일시정지된 Workspace에서도 위 상세 정보가 그대로 보여요. 다시 켜기 전에 설정을 한 번 더 확인할 수 있어요.
</Note>

## 비용 상태(Billing States)

| 상태         | 비용               |
| ---------- | ---------------- |
| Running    | GPU + 스토리지       |
| Paused     | 스토리지만(GPU = \$0) |
| Terminated | 비용 없음            |

## 상태 및 히스토리(Status & History)

Workspace의 현재 상태와 과거 기록을 자세히 볼 수 있어요.

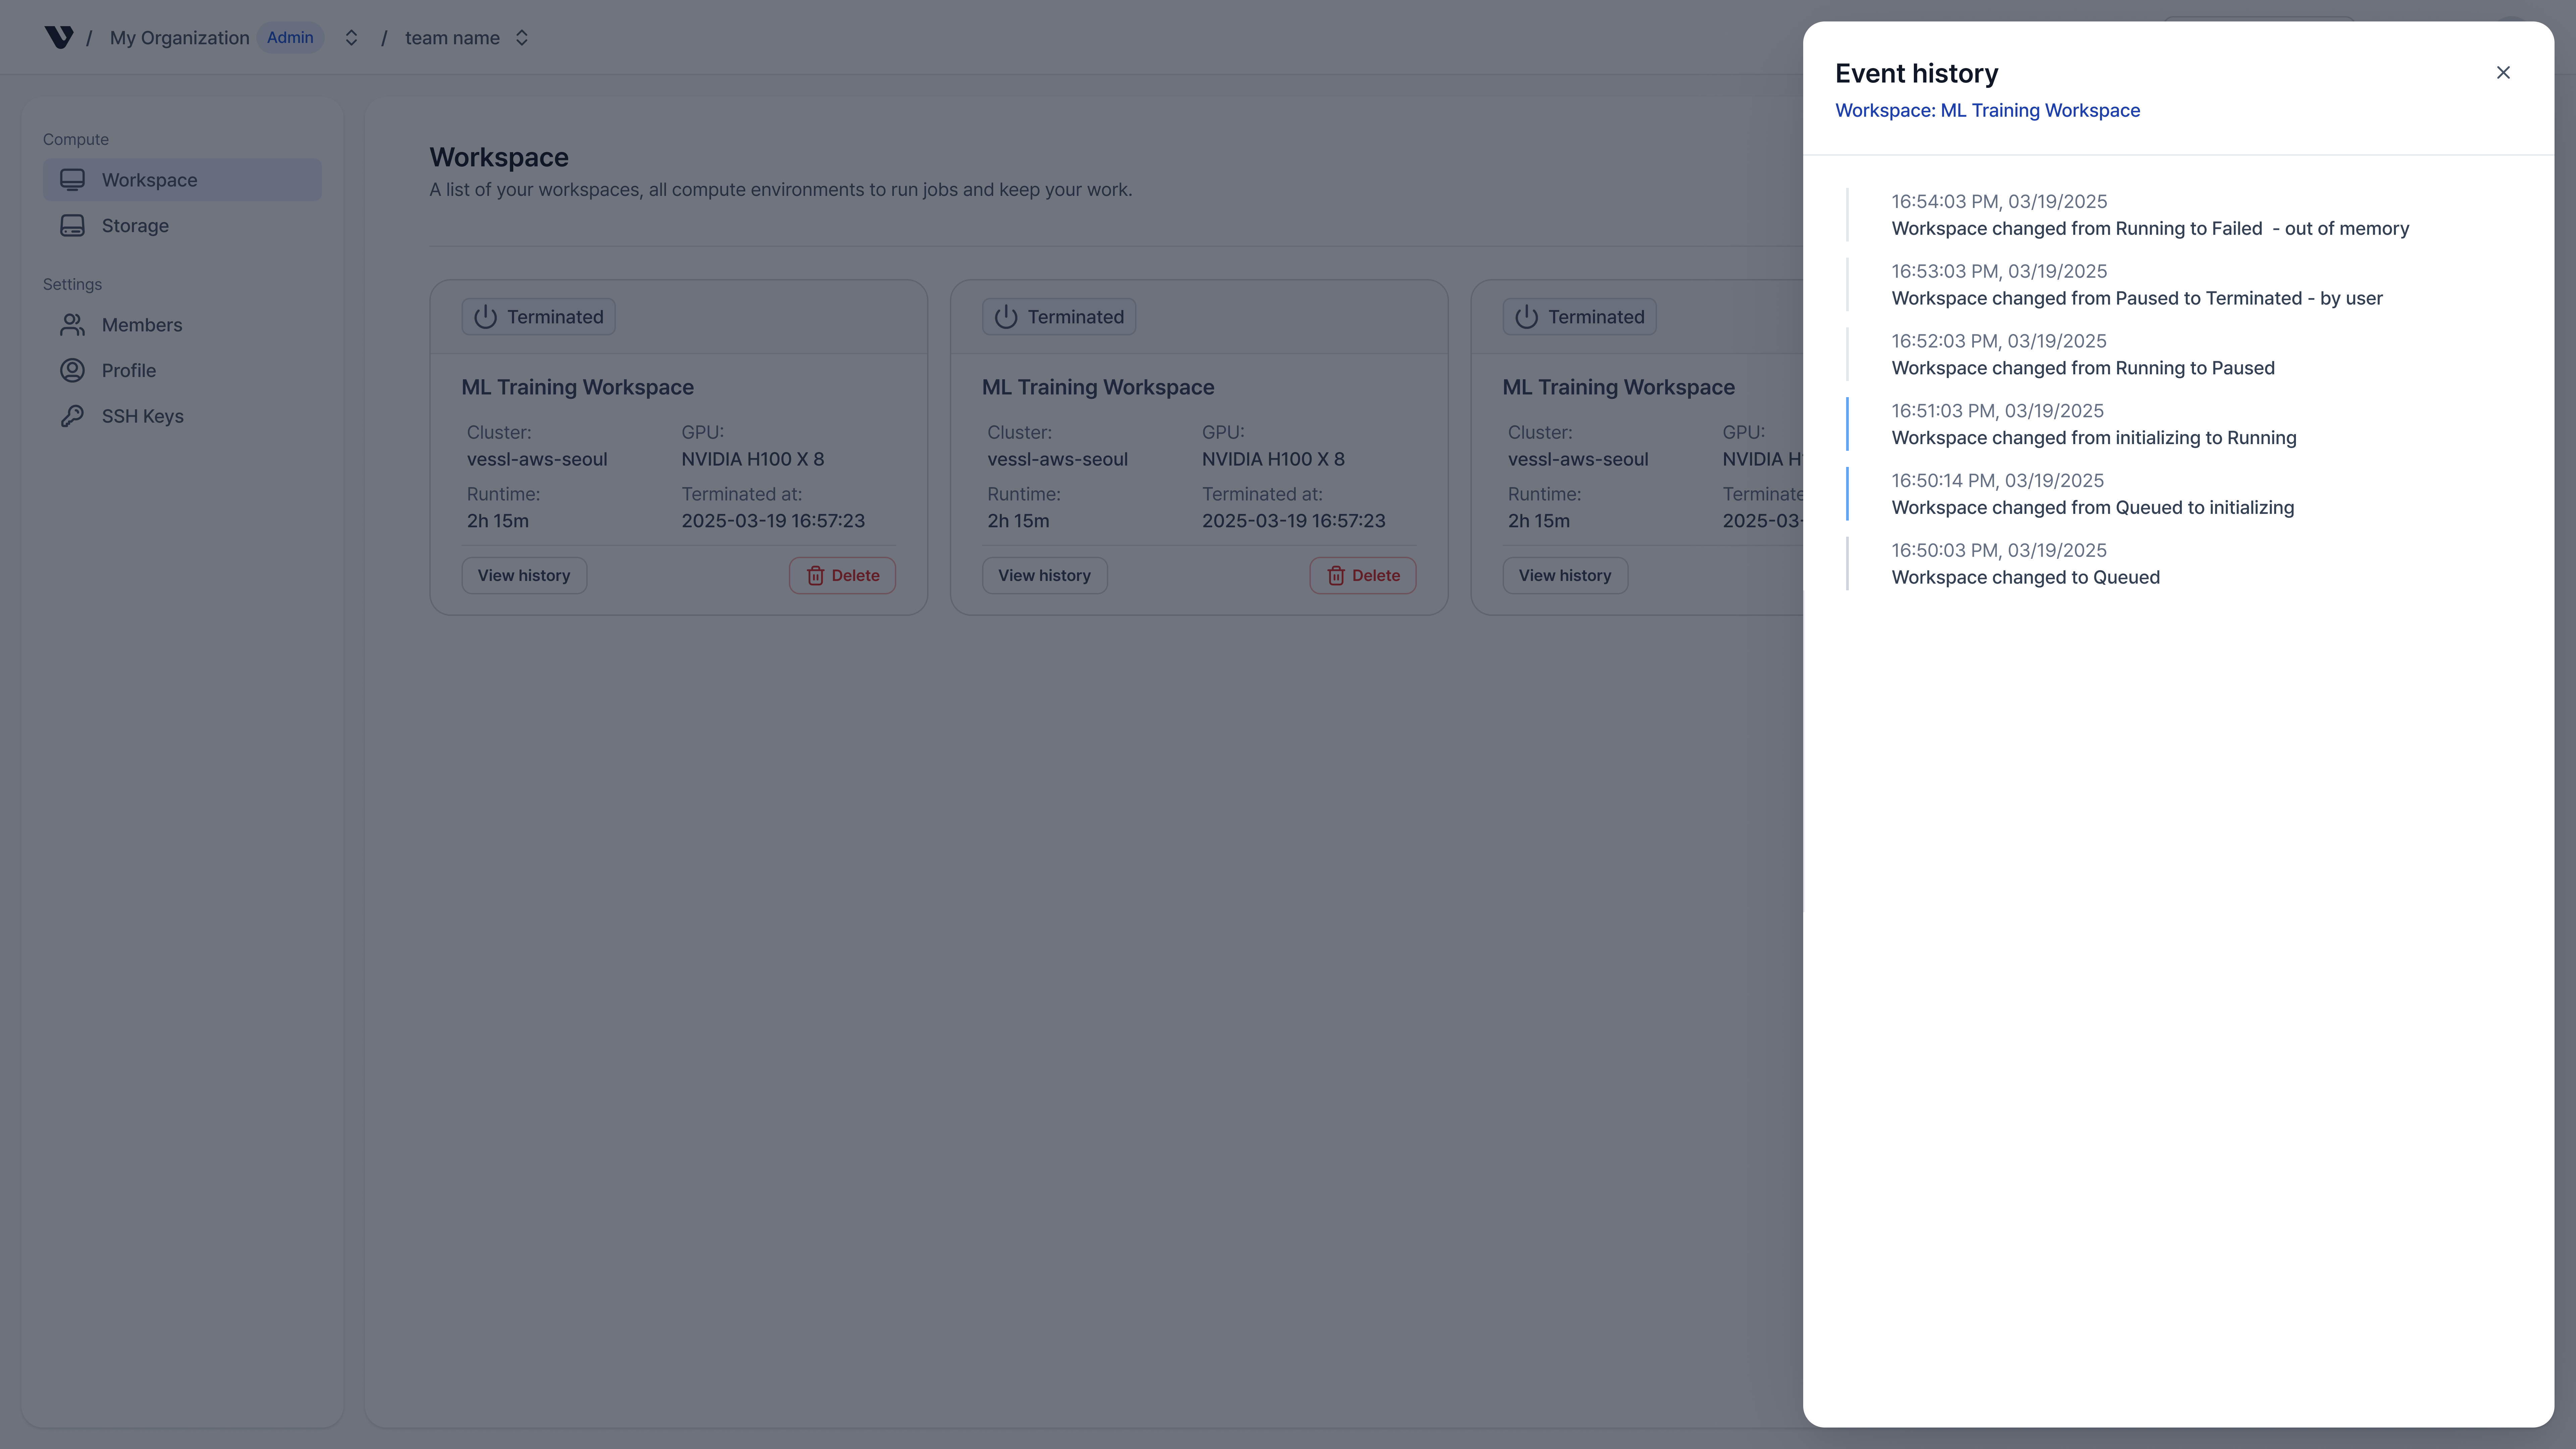
<Tip>아래 데모에서 Workspace 상세 화면의 **Event history**에서 이벤트 타임라인을 확인하는 방법을 볼 수 있어요.</Tip>

<div style={{ position: 'relative', paddingBottom: 'calc(65.9375% + 41px)', height: 0, width: '100%' }}>
  <iframe src="https://demo.arcade.software/QZdF2uBNQySC81o0Mm5K?embed&embed_mobile=inline&embed_desktop=inline&show_copy_link=true" title="View the Activity History of a Terminating Workspace" frameBorder="0" loading="lazy" webkitAllowFullScreen="" mozAllowFullScreen="" allowFullScreen allow="clipboard-write" style={{ position: 'absolute', top: 0, left: 0, width: '100%', height: '100%', colorScheme: 'light' }} />
</div>

<div>
  <Frame>
    <img src="https://mintcdn.com/dora/0WcPwKFrpA0t7Fn7/images/workspace_event_history.png?fit=max&auto=format&n=0WcPwKFrpA0t7Fn7&q=85&s=c369ce932500a0b15692f5b6a98828c4" alt="Workspace 상태 전환과 에러를 시간순으로 보여주는 Event history 패널" width="7680" height="4320" data-path="images/workspace_event_history.png" />
  </Frame>

  <small>예시: Workspace 이벤트 히스토리</small>
</div>

<Info>
  상태 패널에서 확인할 수 있는 항목들:

  * **Detailed status**: `Queued`나 `Initializing` 상태일 때 왜 기다리는지(예: *GPU 자원 대기 중*, *이미지 다운로드 중*)
  * **Event history**: 상태 전환, 에러(예: `OOMKilled`, 크레딧 부족), 스케줄링 이벤트 타임라인
  * **Runtime**: 실행 중일 때 경과 시간, 일시정지 시 `N/A`, 종료 시 총 실행 시간
</Info>

## 함께 보기

* [Connect](/ko/member/workspace/connect): 접속 방법 알아보기
* [Pricing](/ko/pricing/gpu-instances): 가격 정책 확인하기