> ## Documentation Index
> Fetch the complete documentation index at: https://docs.cloud.vessl.ai/llms.txt
> Use this file to discover all available pages before exploring further.
# Monitor workloads
> View your active workloads, GPU usage, and spend rate at a glance.
The Home dashboard gives you a single view of all your running workloads across every team you belong to. Click **Home** in the sidebar to open the dashboard.
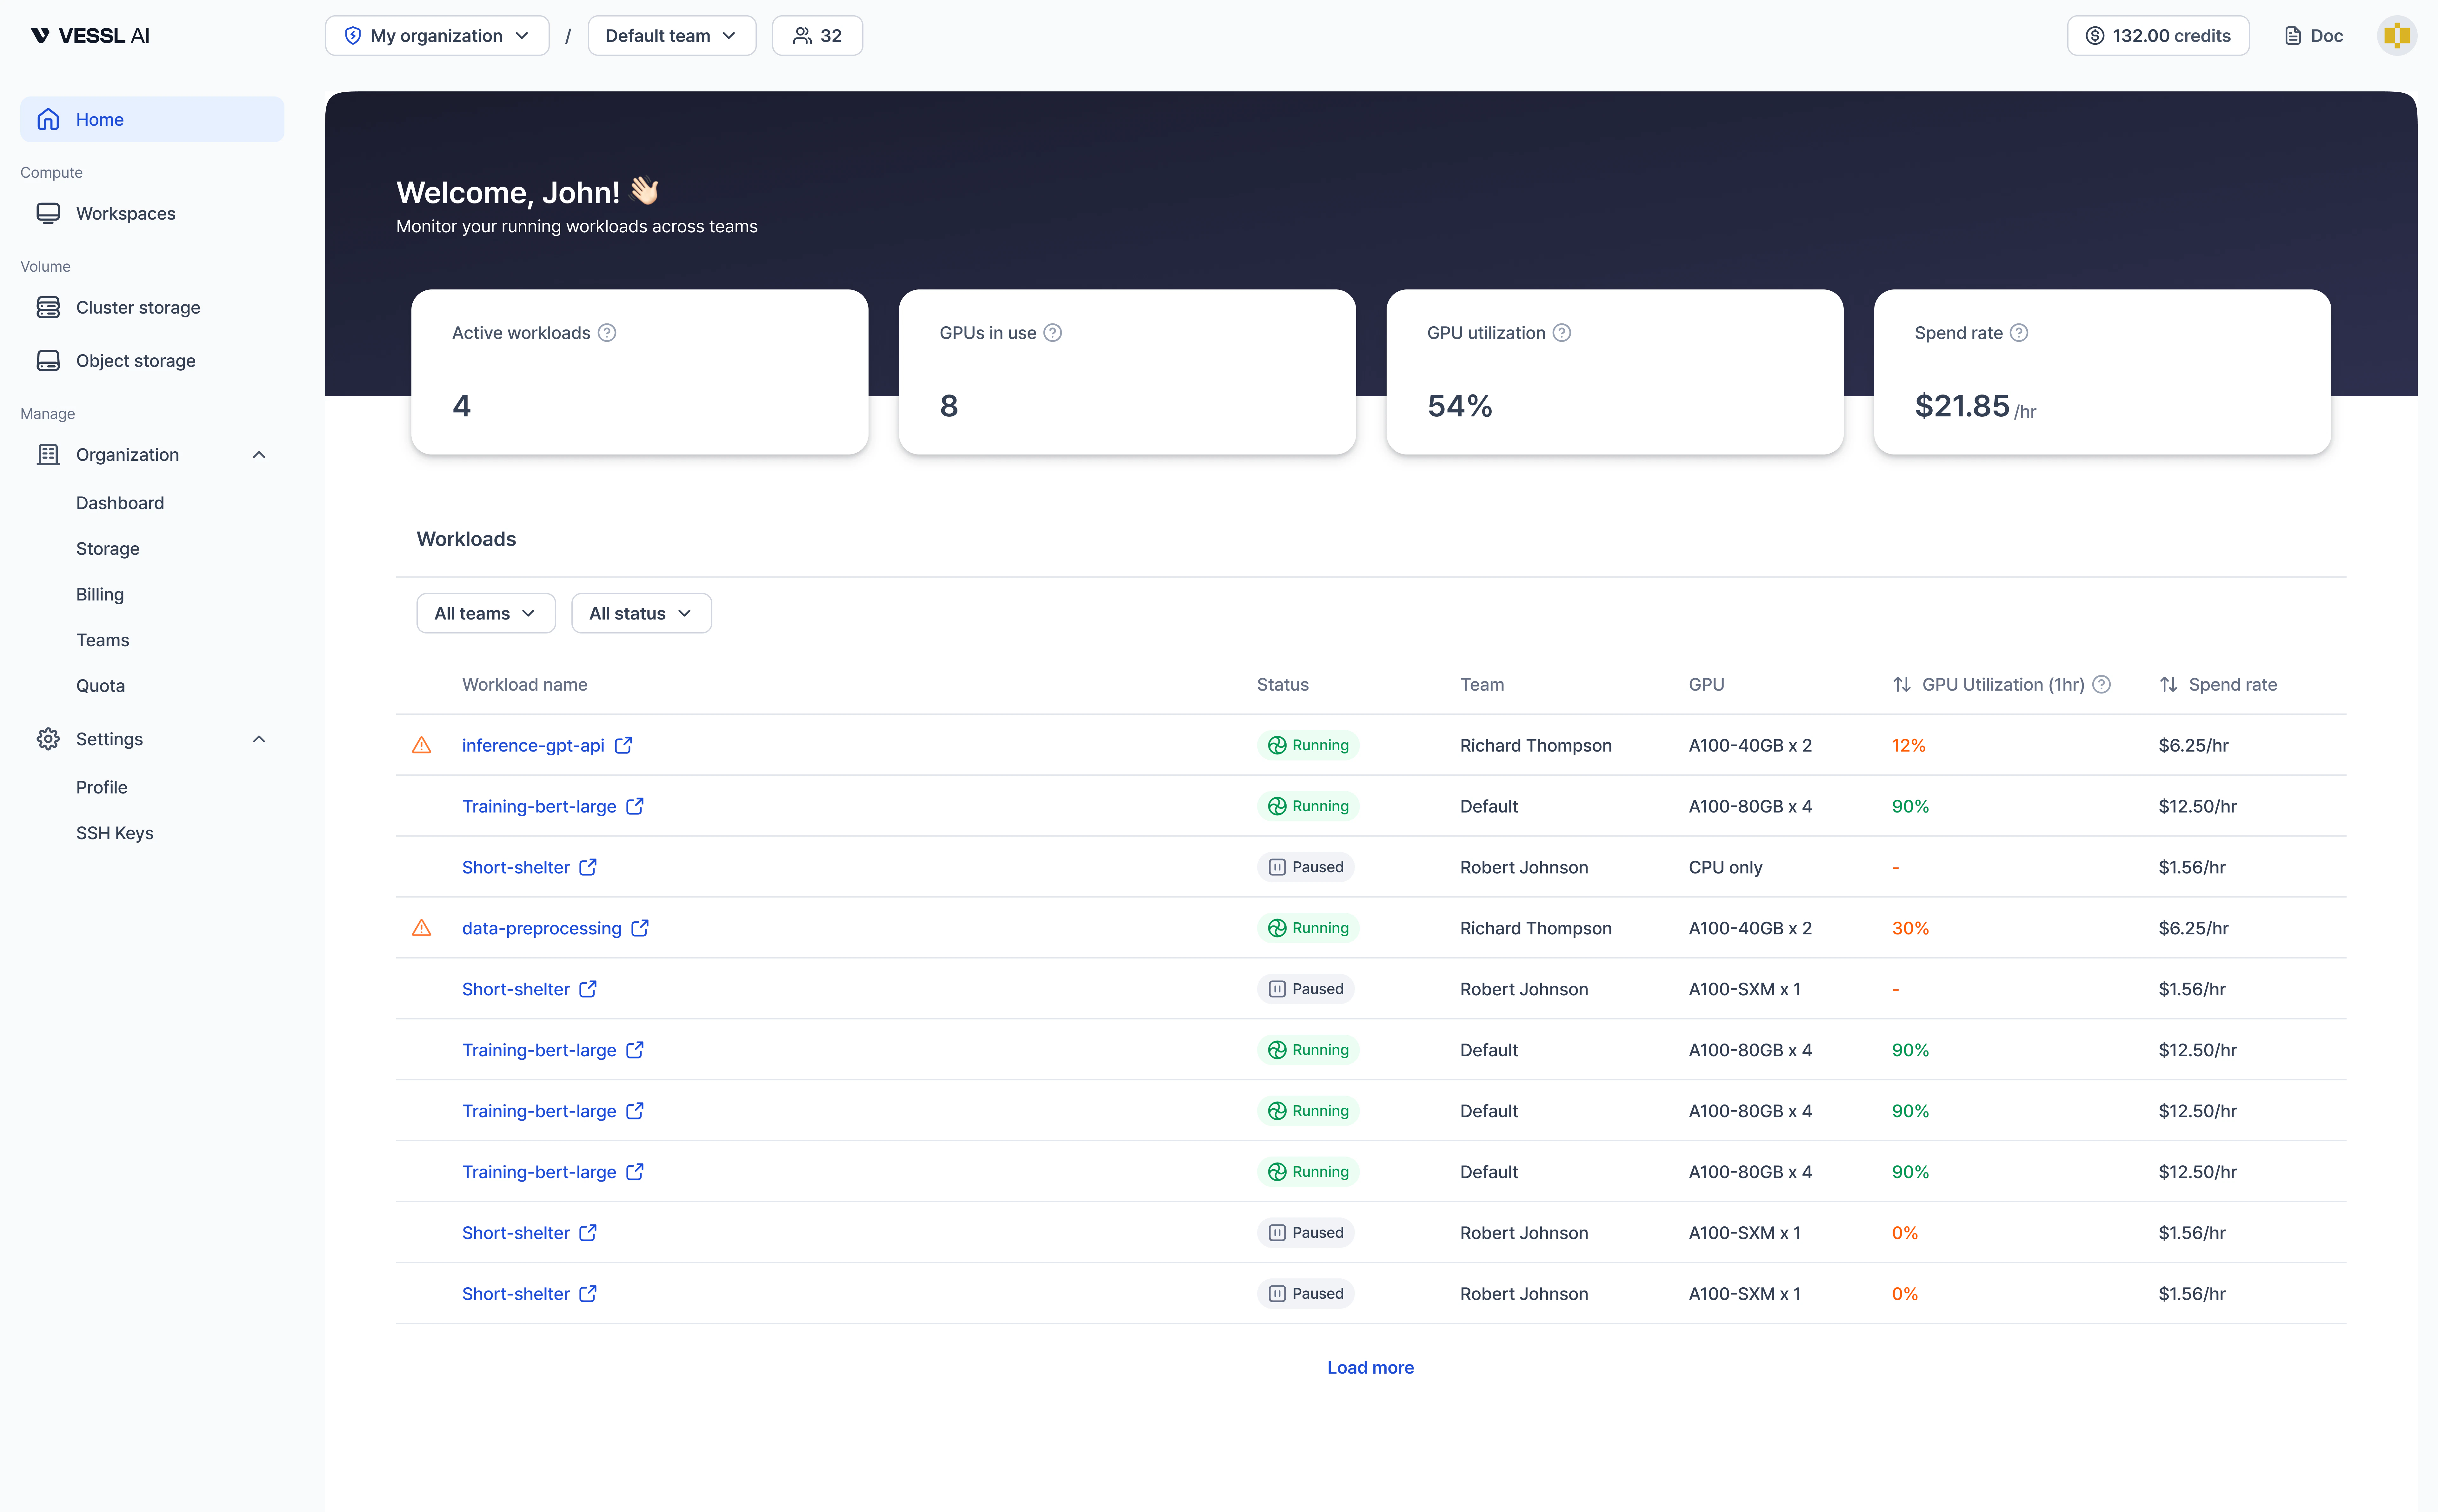 Example: Home dashboard with summary cards and workload list
## Summary cards
Four cards at the top provide an at-a-glance overview of your workloads.
| Card | Description |
| -------------------- | ------------------------------------------------------------------------------------------------------------------------------------------------------------------------- |
| **Active workloads** | Total number of your workloads excluding terminated ones (running, paused, queued, and initializing) |
| **GPUs in use** | Number of GPUs currently allocated to your running workspaces |
| **GPU utilization** | One-hour GPU-weighted average across your running workspaces. If runtime is under one hour, the card stays in a temporary collecting state (for example, `Collecting...`) |
| **Spend rate** | Current hourly cost across all your running workspaces (\$/hr). Excludes storage costs |
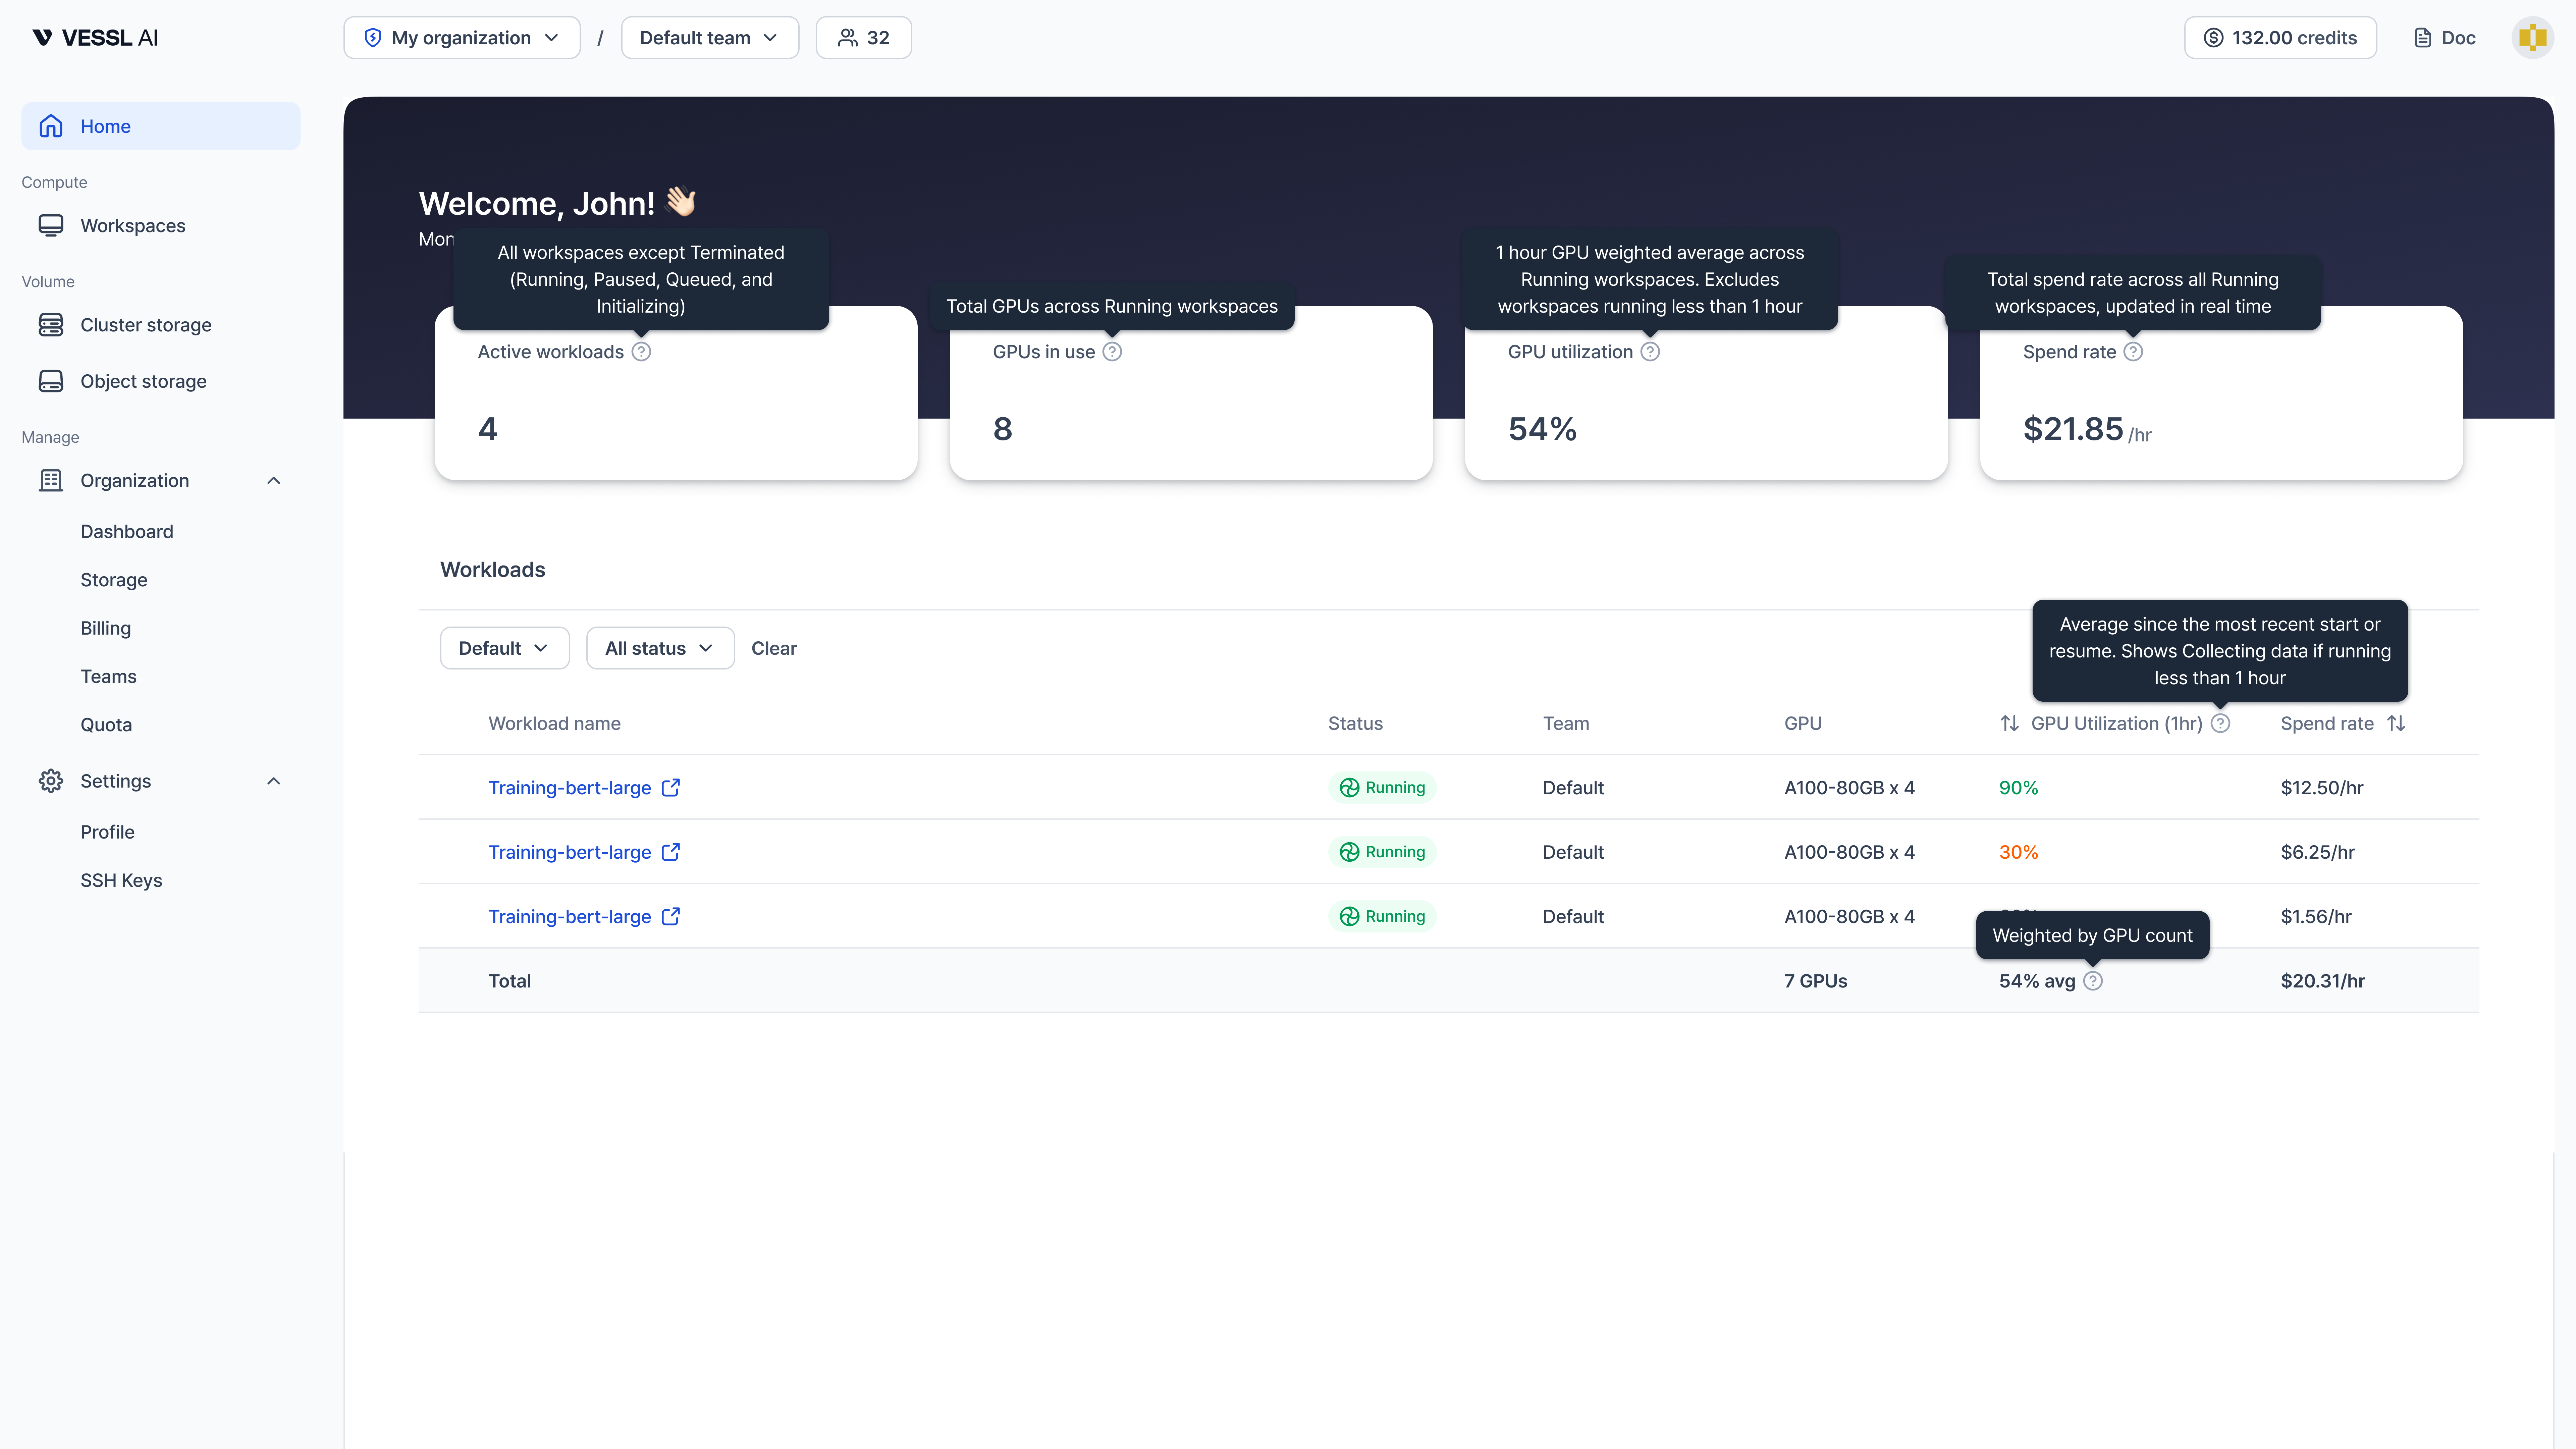 Example: Hover over tooltip icons to see how each metric is calculated
Hover over the tooltip icon on each card to see how the metric is calculated.
## Workloads
The workloads table lists your active workspaces grouped by team.
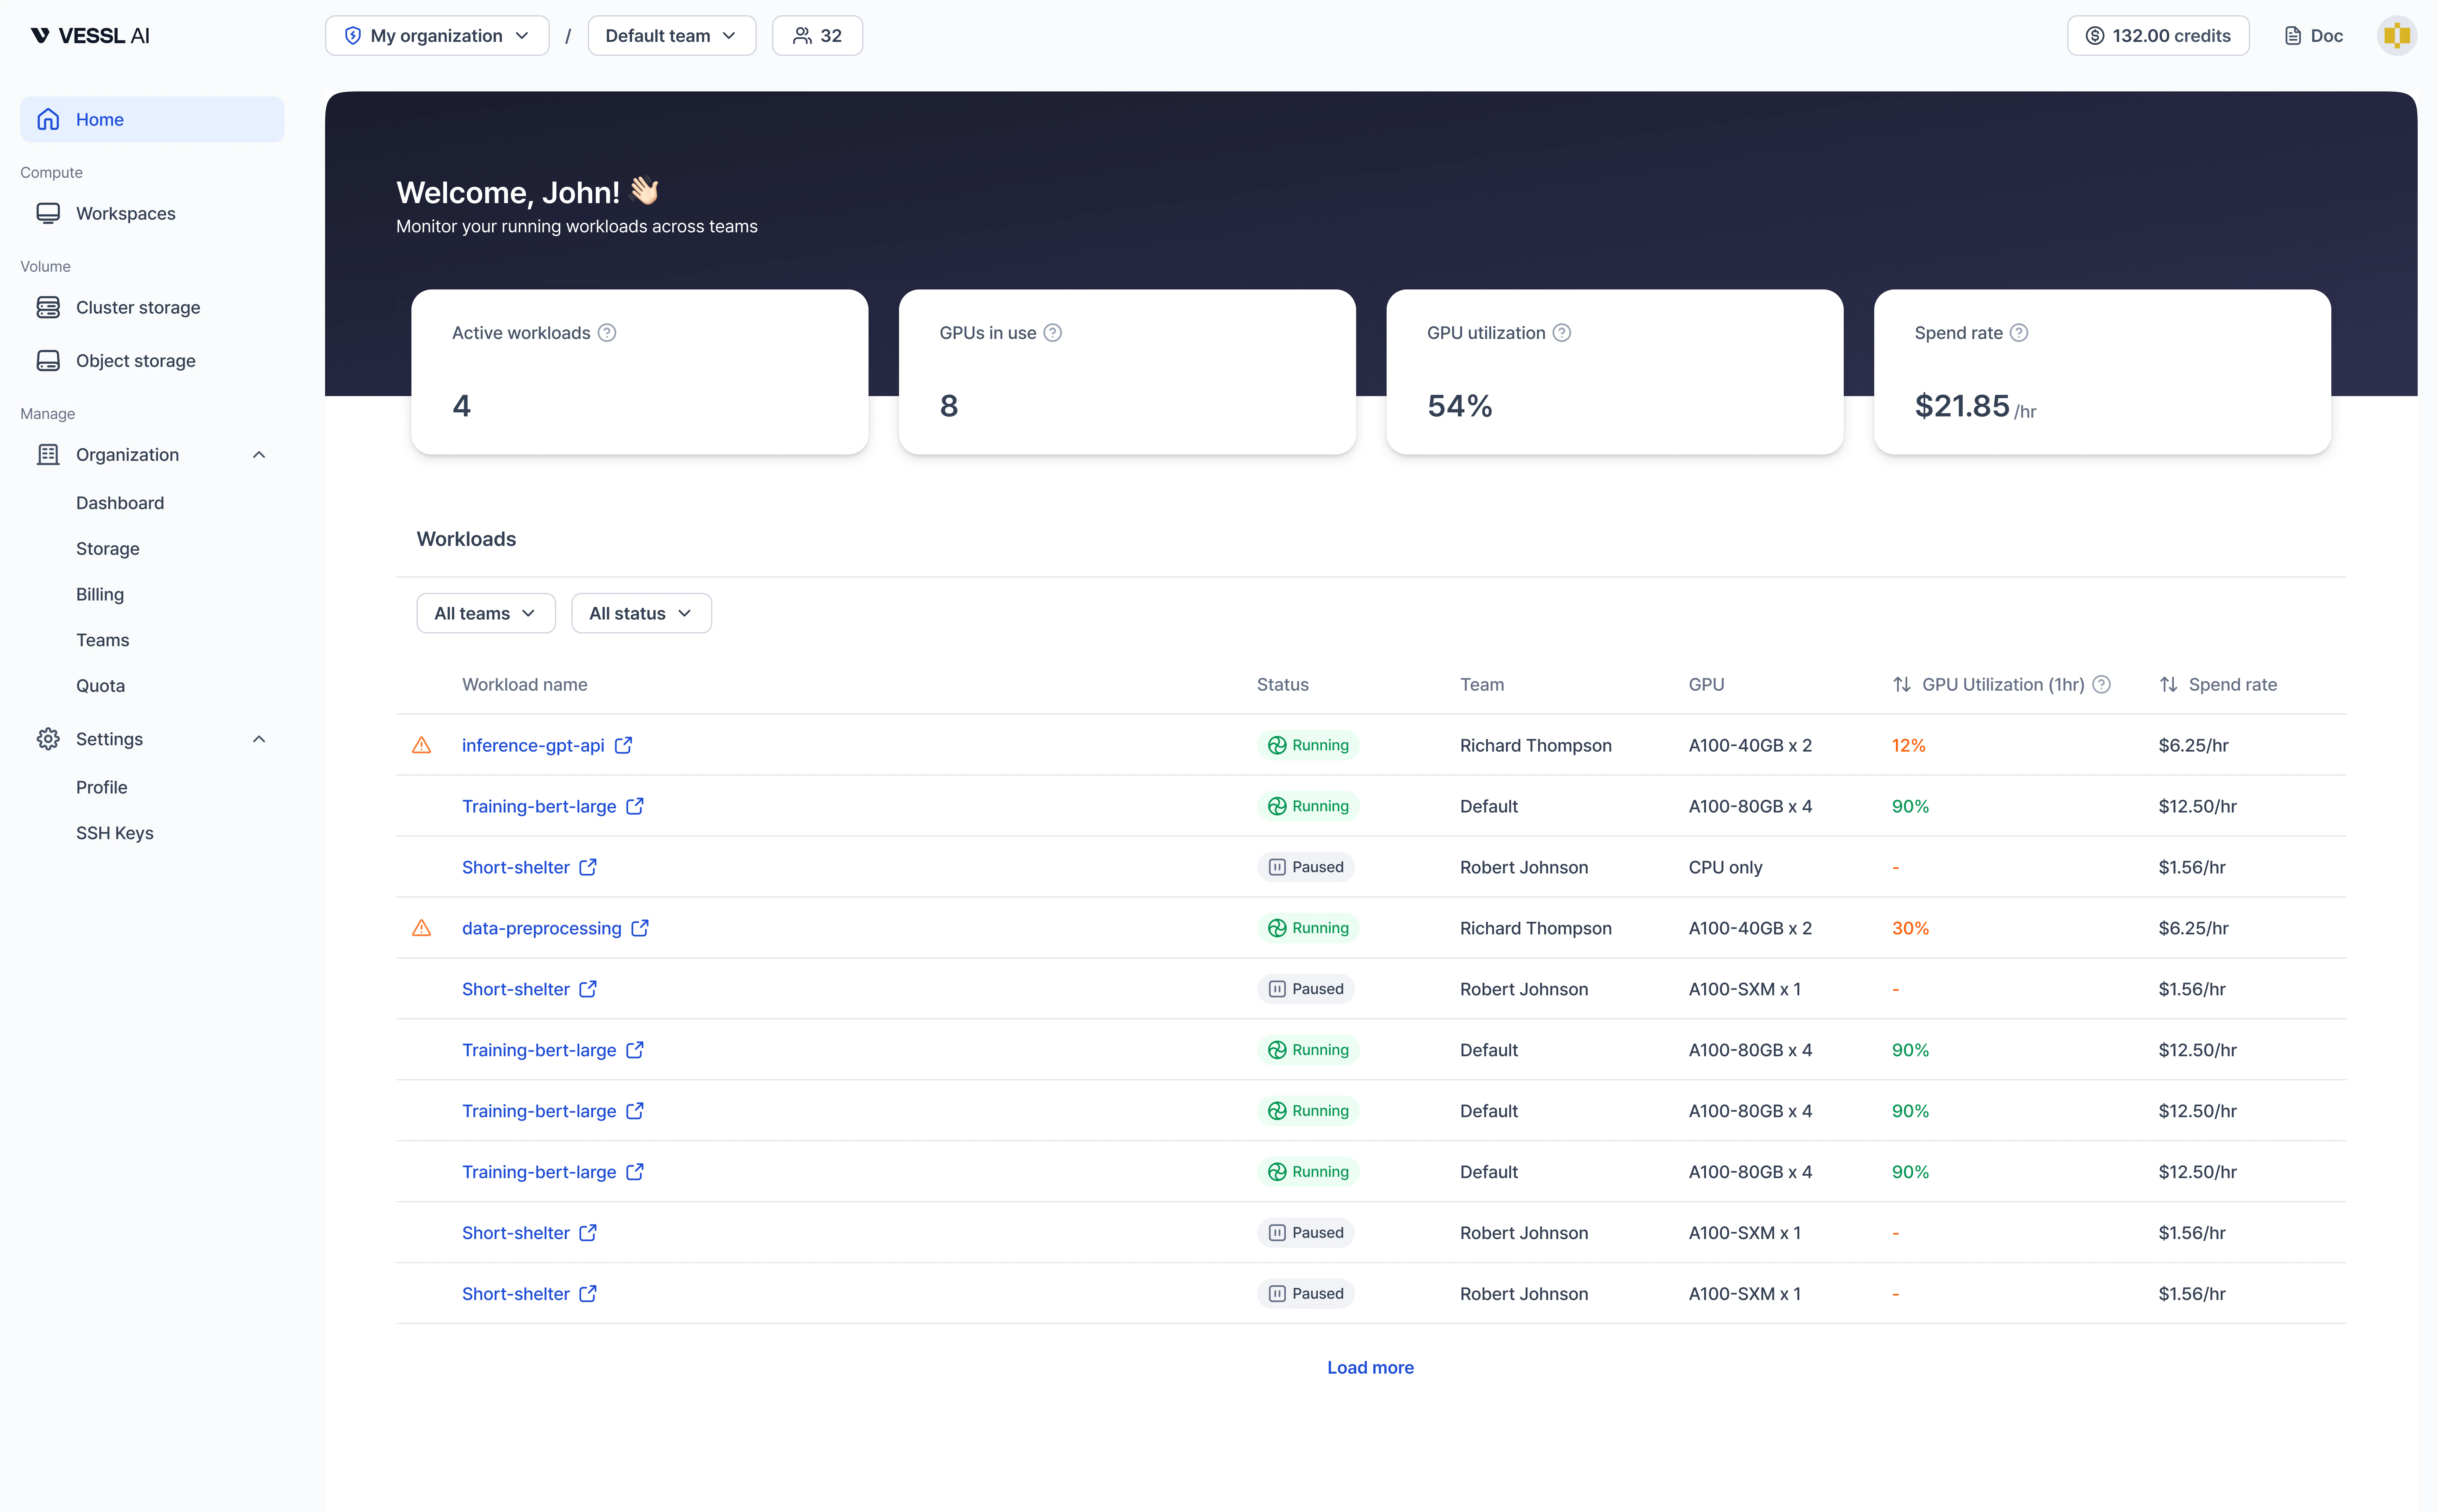 Example: Workloads table
### Filters
* **Team**: Show workloads from a specific team or all teams
* **Status**: Filter by workload status (for example, Running, Paused)
* **Clear**: Reset all filters
### Table columns
| Column | Description |
| ------------------------- | ------------------------------------------------------------------------------------------------------------------------------------- |
| **Workload name** | Workspace name. Workloads with low GPU utilization show an under-utilization warning. Click to open the workspace detail page. |
| **Status** | Current status (Running, Paused, Stopped, and so on) |
| **Team** | Team the workload belongs to |
| **GPU** | GPU type and count (for example, "A100-80GB x 4") |
| **GPU Utilization (1hr)** | One-hour average GPU utilization, weighted by GPU count. Color-coded: green (**90%**+), gray (**30**–**90%**), orange (below **30%**) |
| **Spend rate** | Hourly cost for this workload (\$/hr) |
When you filter by a specific team, a **Total** row appears at the bottom showing combined GPU count, average utilization, and total spend rate.
## Quickstart cards
When you have no running workloads, the dashboard shows three quickstart cards to help you get started:
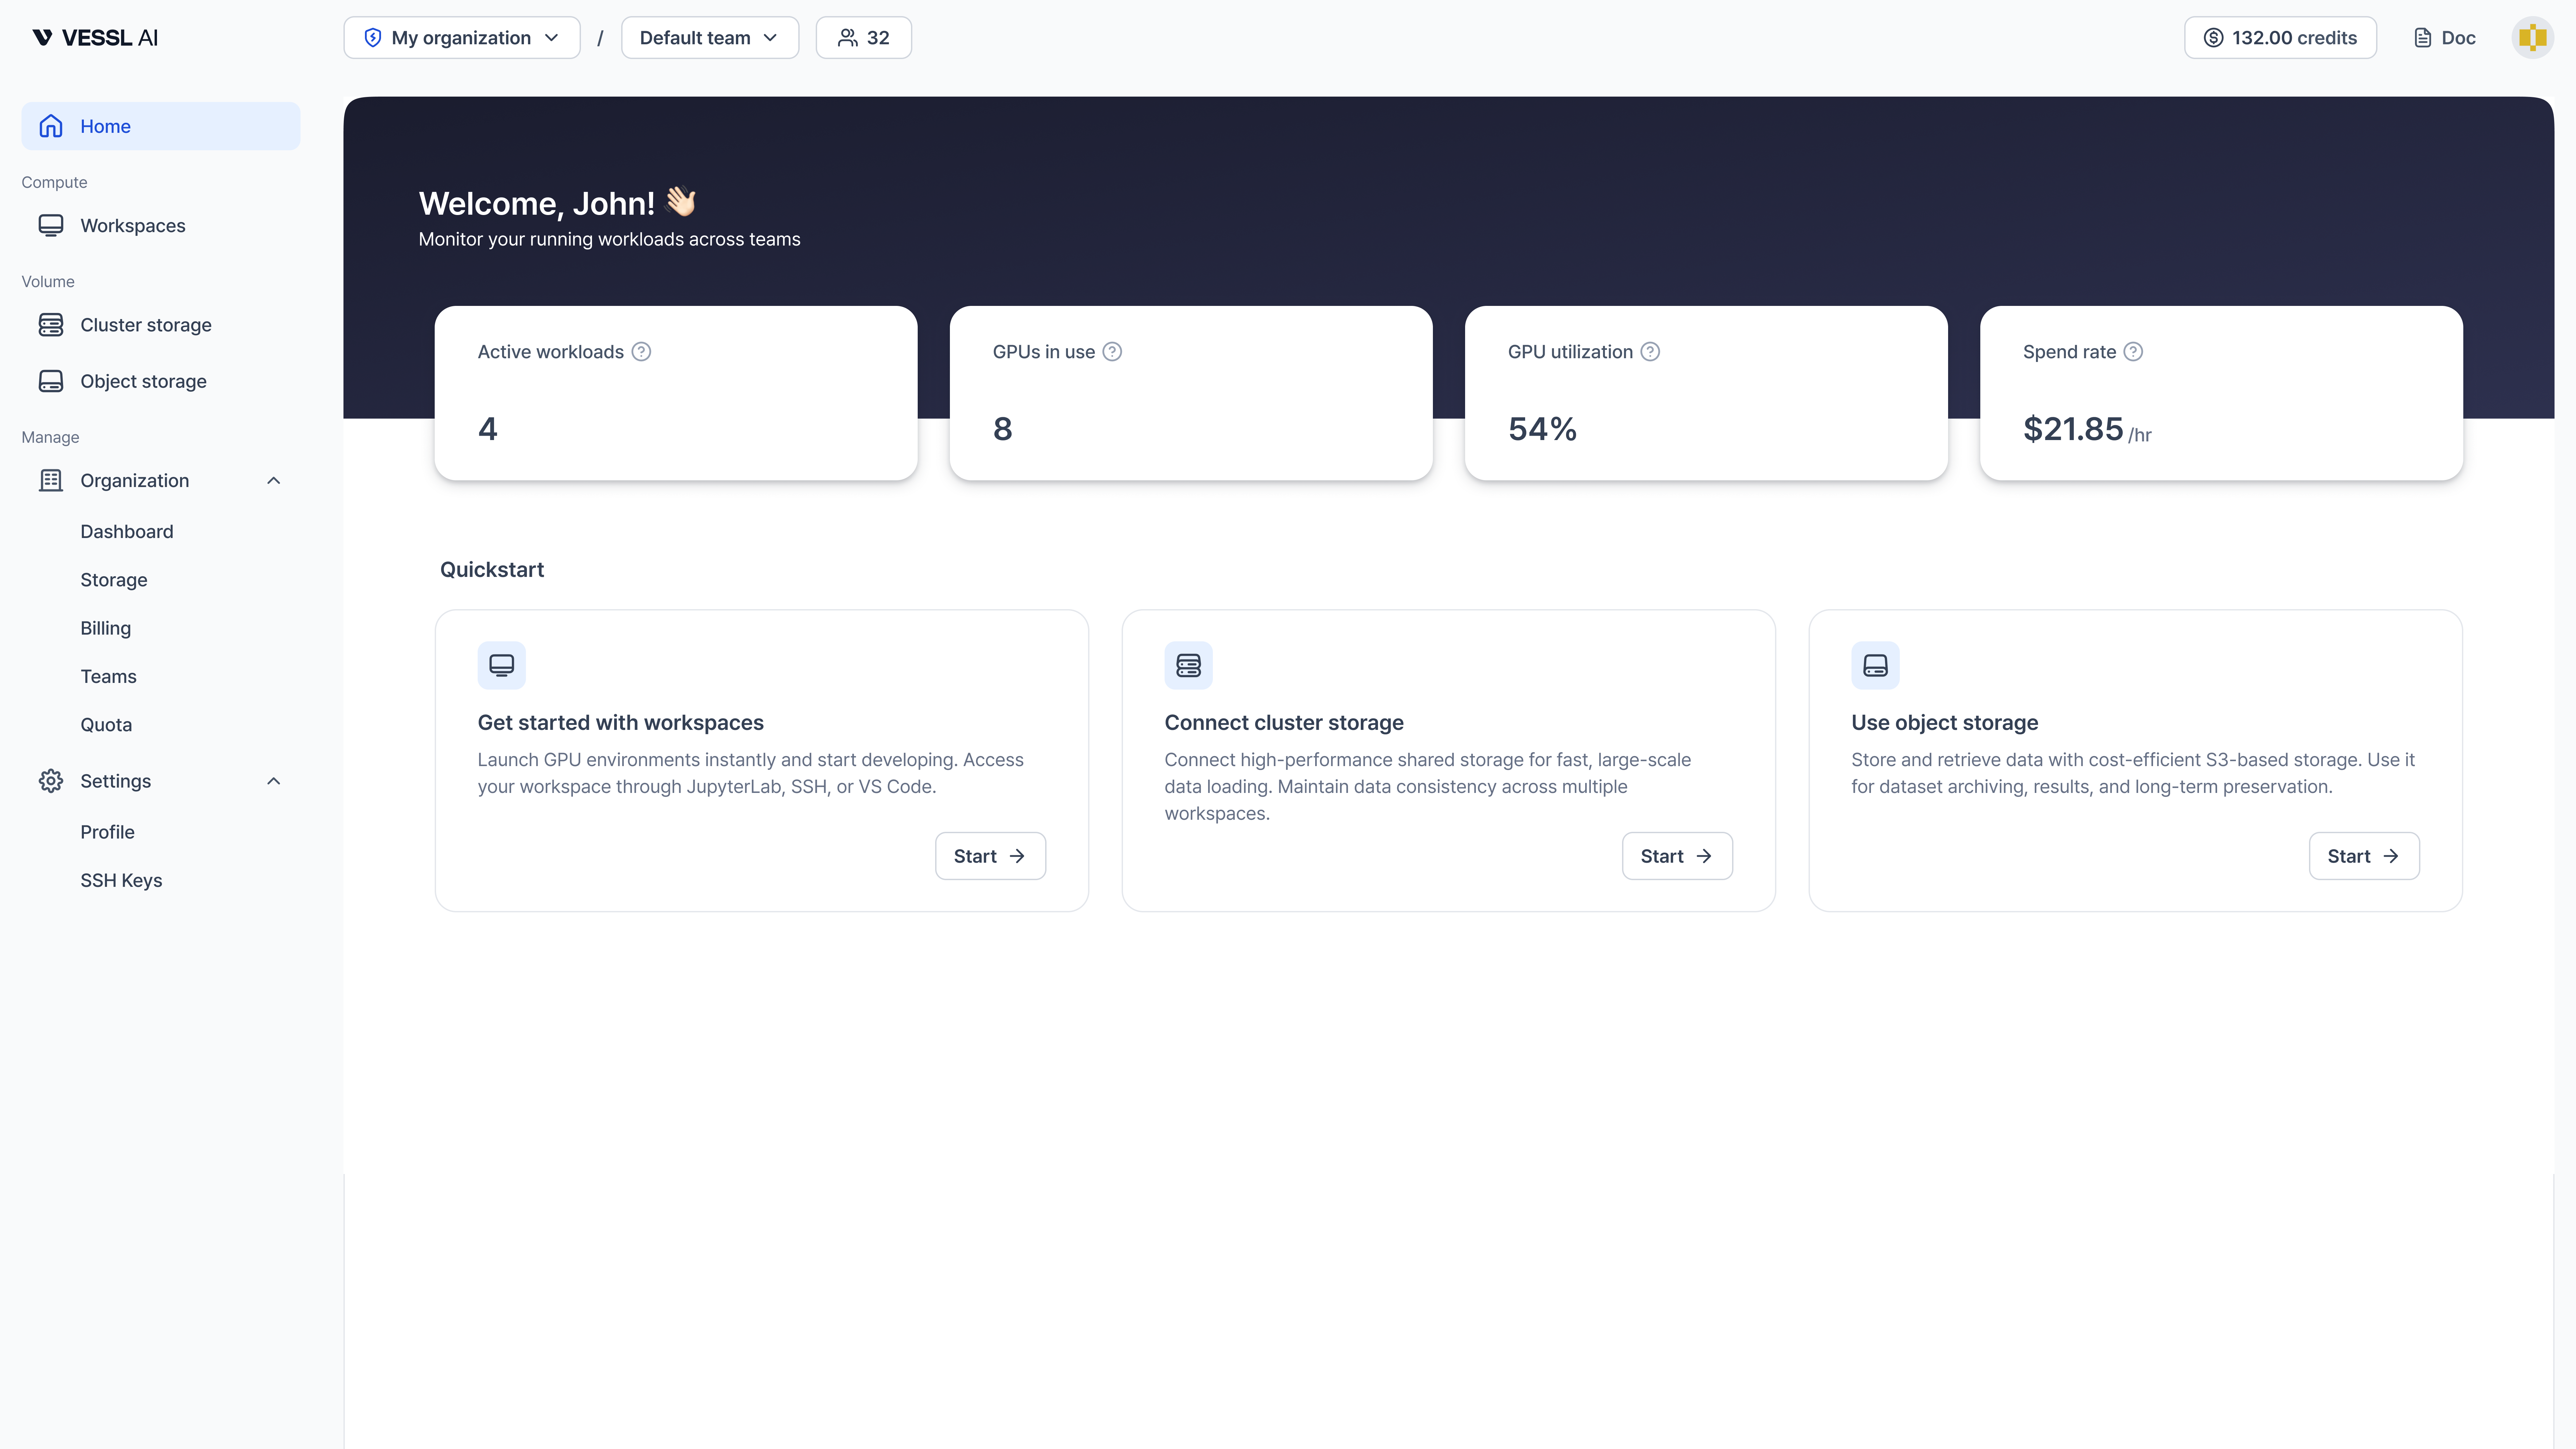 Example: Quickstart cards
* **Get started with workspaces** — Launch a GPU environment and start developing
* **Connect Cluster storage** — Set up high-performance shared storage for fast, large-scale data loading
* **Use Object storage** — Store and retrieve data with cost-efficient S3-based storage for archiving and long-term preservation
## Edge cases
| Scenario | Behavior |
| -------------------------- | ----------------------------------------------------------------------------- |
| No running workloads | Quickstart cards are displayed instead of the workload table |
| No metric data | Workloads running for less than one hour stay in a temporary collecting state |
| No matches after filtering | The table shows an empty-state hint suggesting filter adjustment |
| CPU-only workload | GPU columns show `-` |