> ## Documentation Index
> Fetch the complete documentation index at: https://docs.cloud.vessl.ai/llms.txt
> Use this file to discover all available pages before exploring further.
# View workspace details
> Compute specs, pricing summary, image, and attached storage.
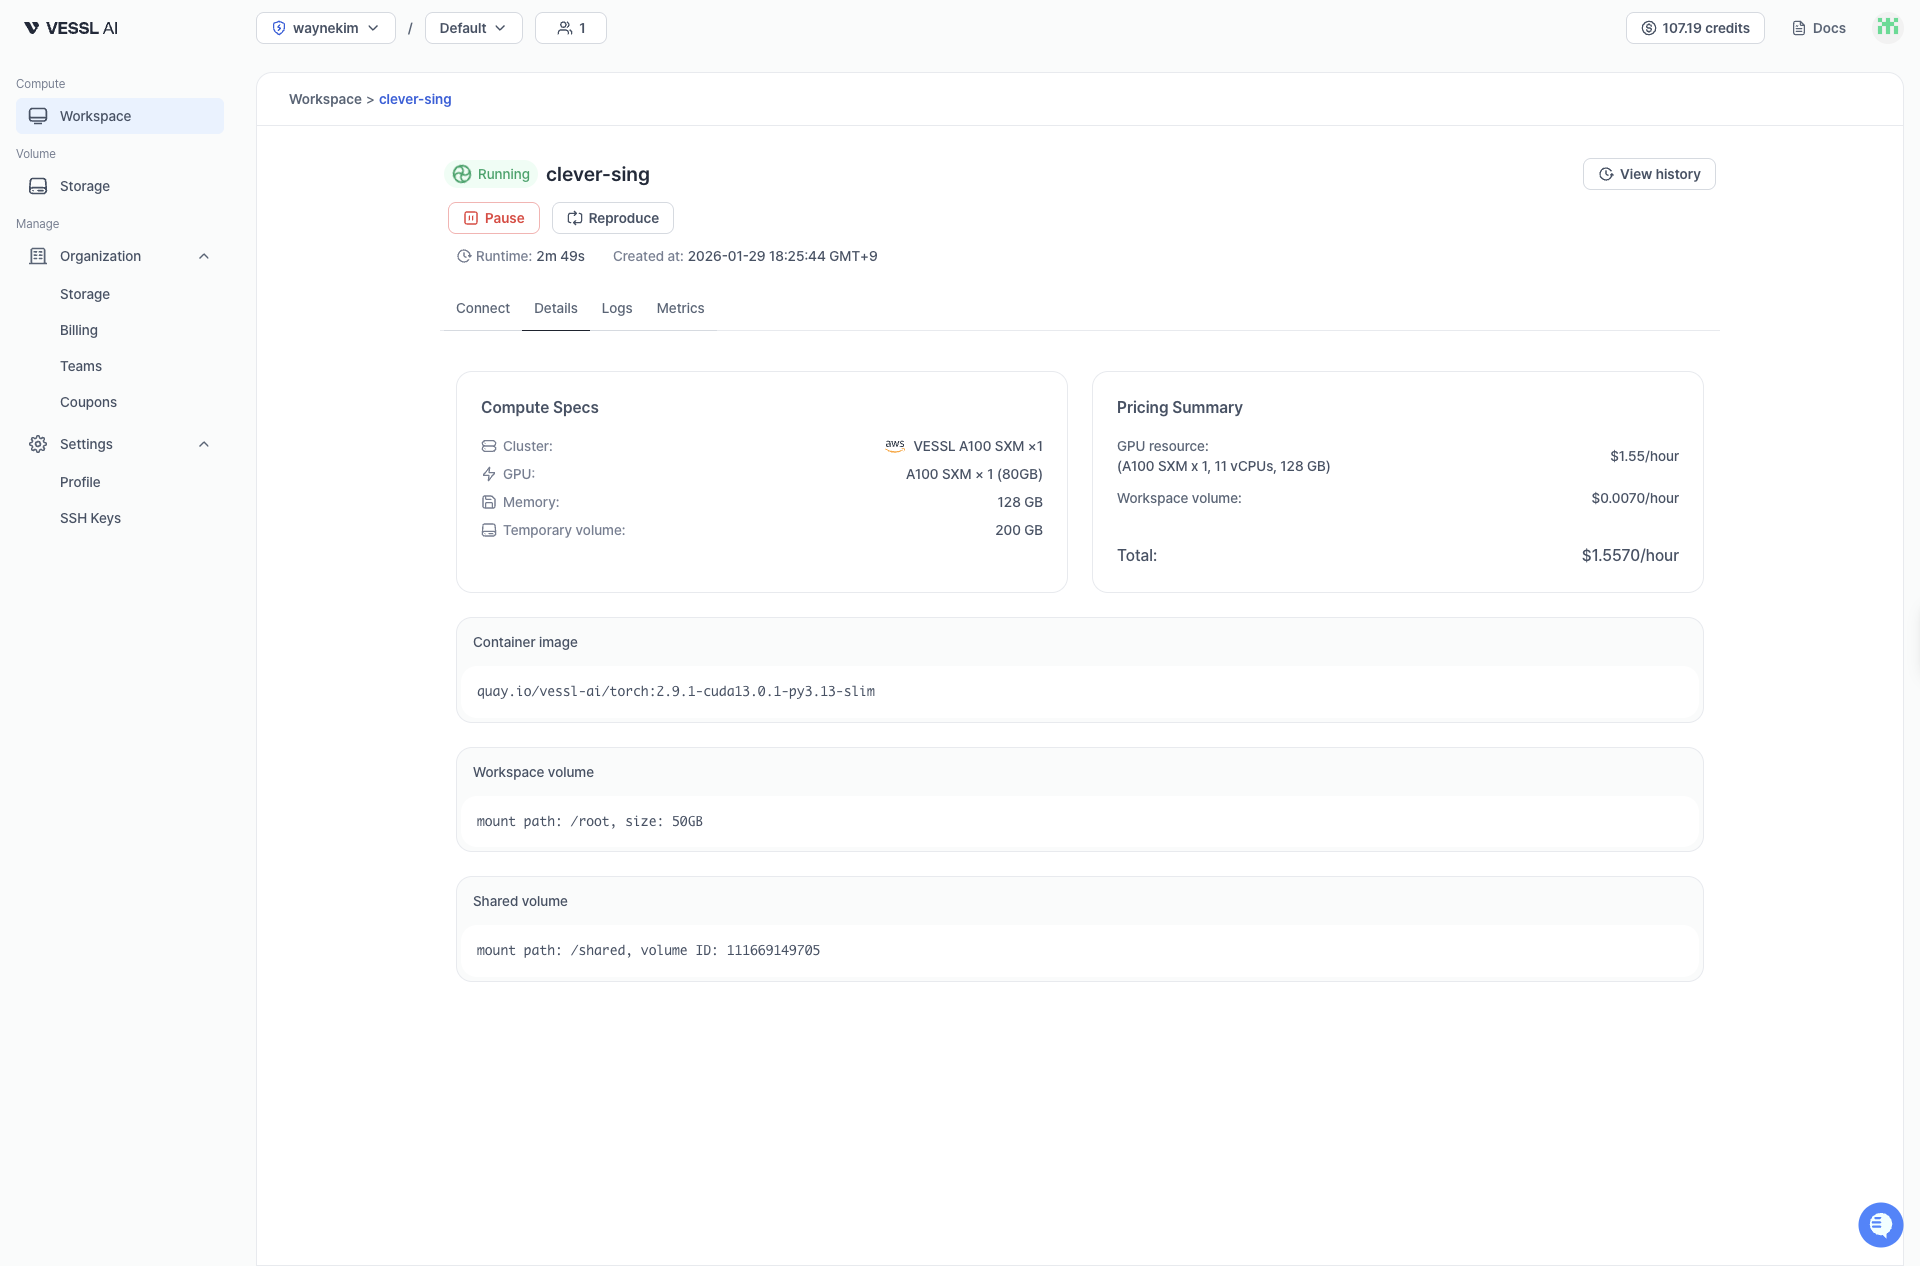 Example: Workspace details
The details page shows the following sections:
* **Compute specs**: Cluster, GPU, CPU, memory, and Temporary storage size
* **Pricing summary**: Hourly GPU resource cost and storage cost
* **Container image**: The Docker image running in the workspace
* **Cluster storage**: Mount path and capacity of Cluster storage volumes
* **Object storage**: Object storage volumes and their mount paths
These details stay visible on paused workspaces too, so you can review the configuration before resuming.
## Cost states
| State | Cost |
| ---------- | ------------------------ |
| Running | GPU + storage |
| Paused | Storage only (GPU = \$0) |
| Terminated | No cost |
## Status & history
Get detailed visibility into your workspace's lifecycle.
Use the demo below to see how to open **Event history** in the workspace details page and review the event timeline.
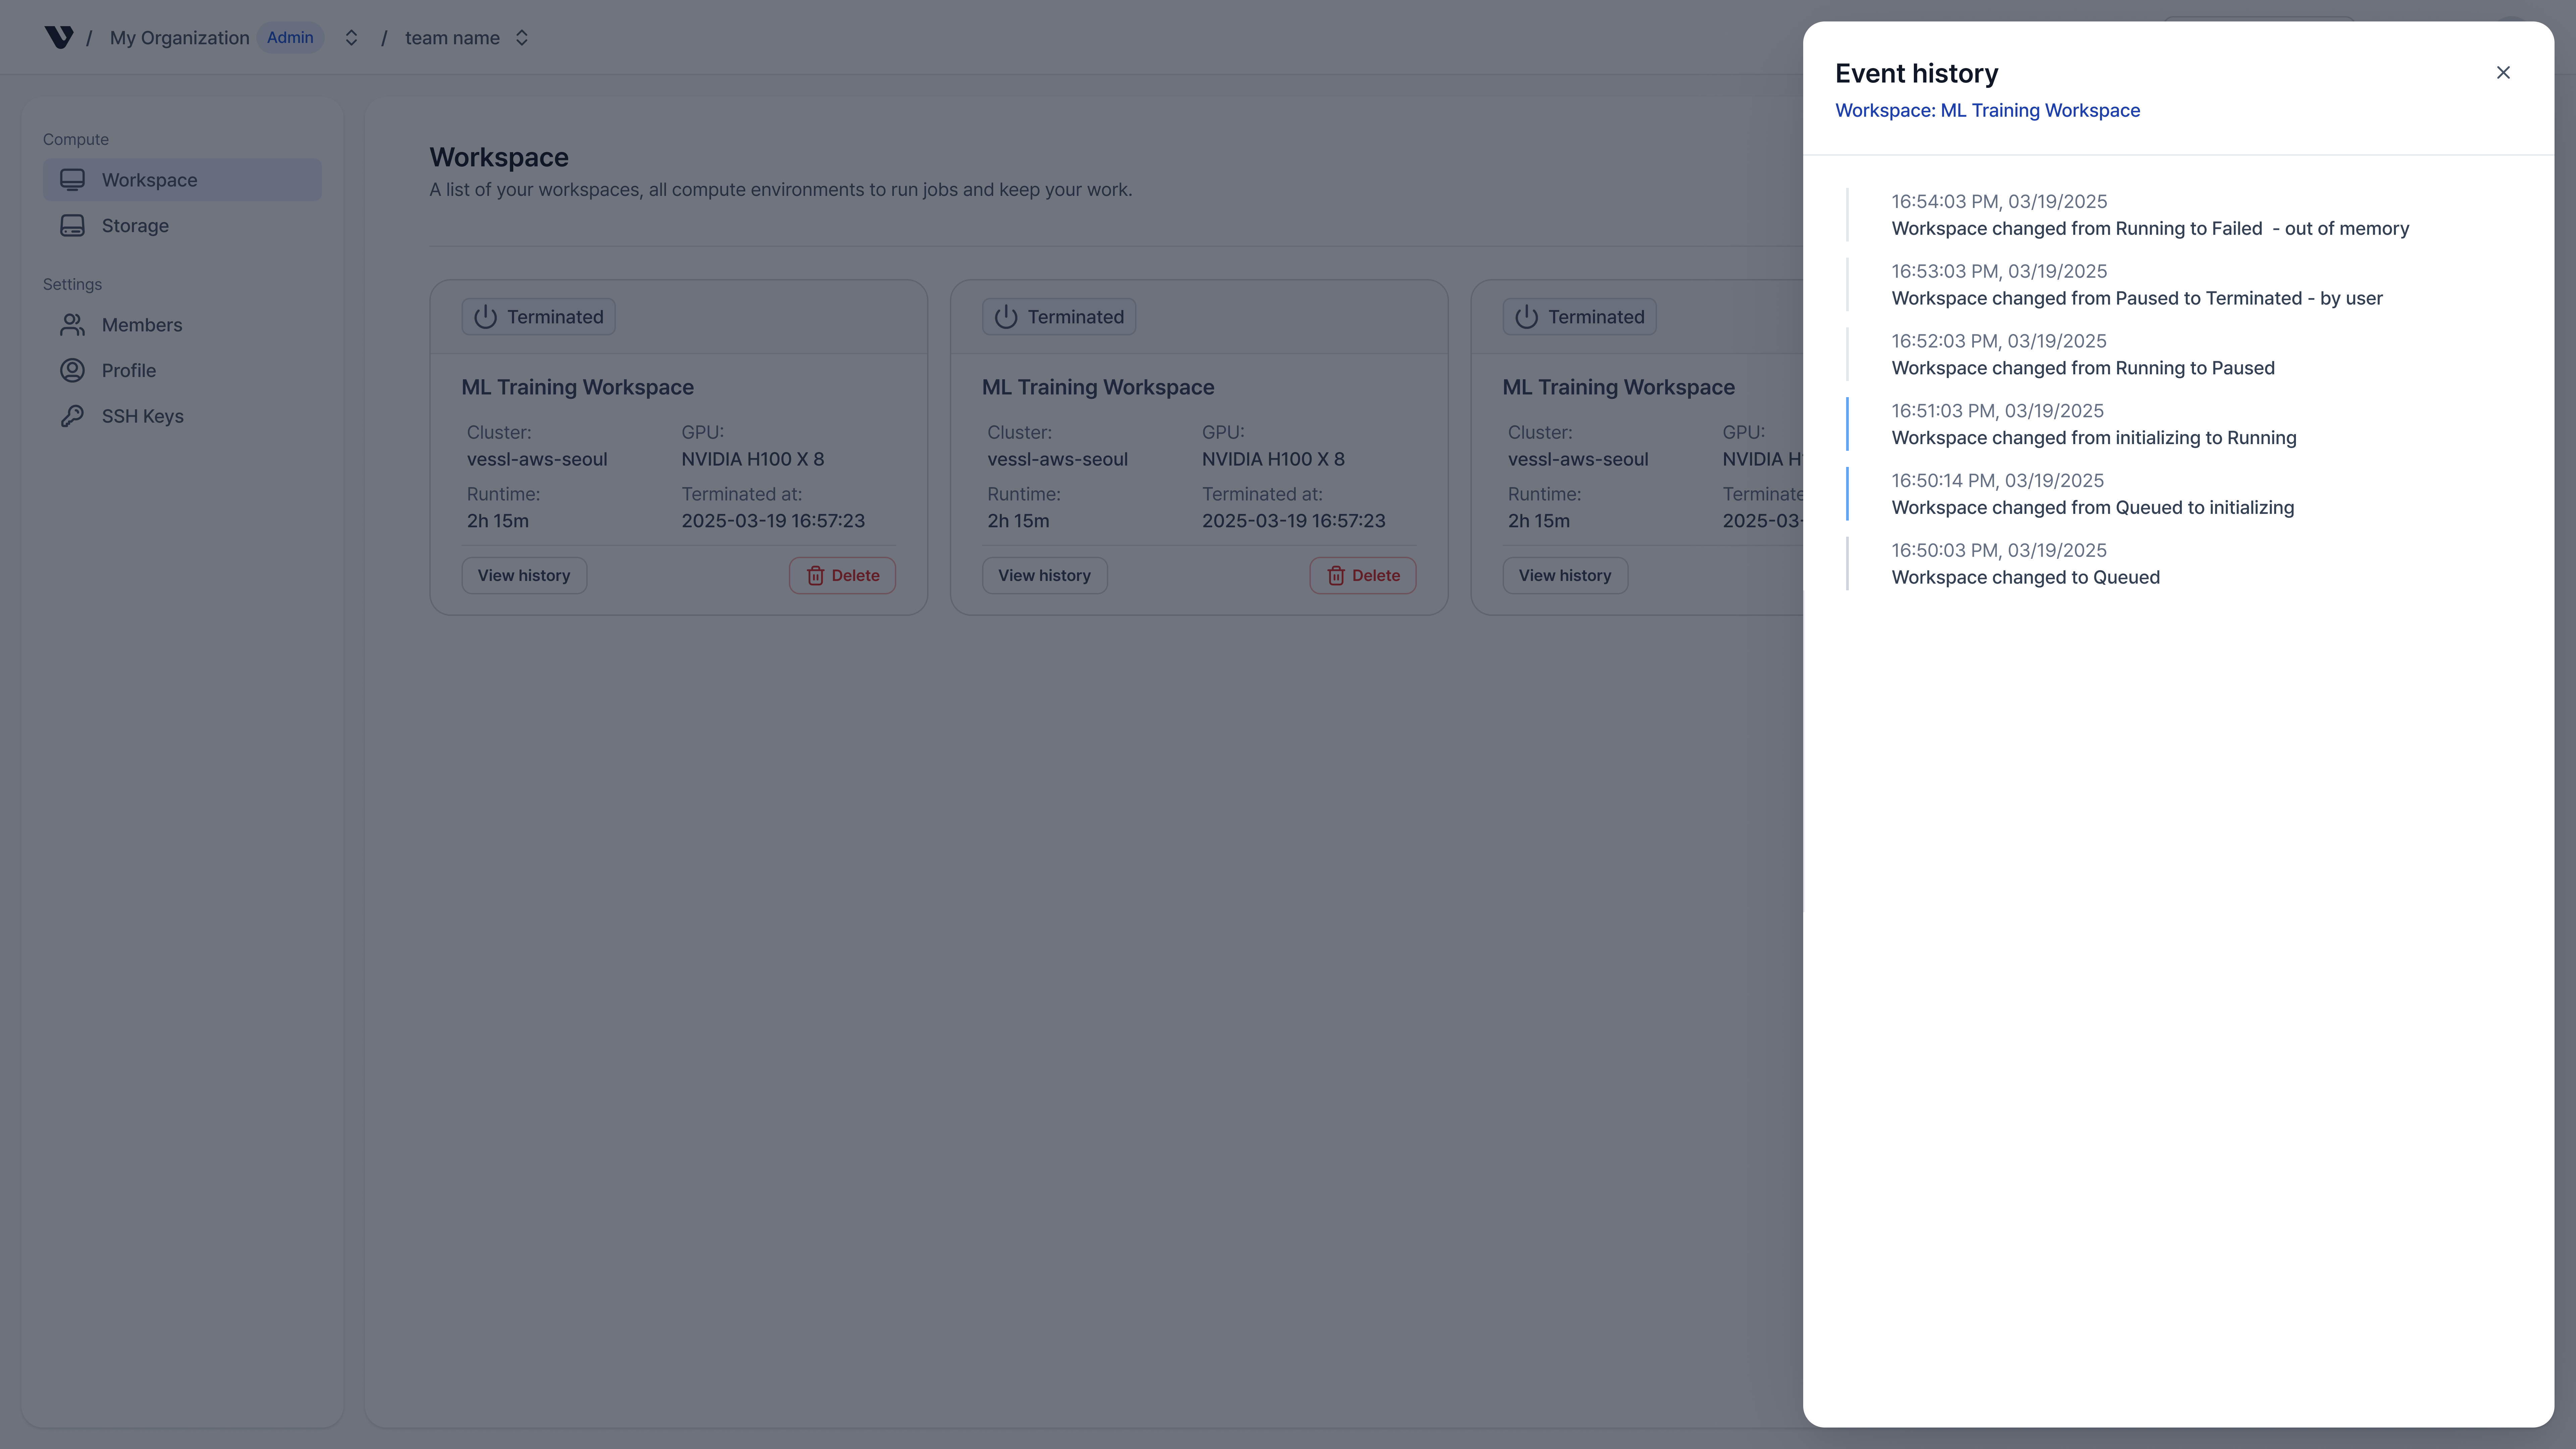 Example: Workspace event history
The status panel shows:
* **Detailed status**: Specific reason — *Waiting for GPU capacity* when `Queued`, *Downloading image* when `Initializing`
* **Event history**: Timeline of state transitions, errors (for example, `OOMKilled`, credit exhaustion), and scheduling events
* **Runtime**: Elapsed time when running, `N/A` when paused, total runtime when terminated
## See also
* [Connect](/member/workspace/connect)
* [Pricing](/pricing/gpu-instances)