> ## Documentation Index
> Fetch the complete documentation index at: https://docs.cloud.vessl.ai/llms.txt
> Use this file to discover all available pages before exploring further.
# Monitor metrics
> Track GPU, VRAM, temperature, CPU, memory, and storage usage for your workspace.
The **Metrics** tab provides timeseries charts for GPU, VRAM, temperature, CPU, memory, and network usage so you can track performance, detect bottlenecks, and identify resource waste.
You can also open the **Metrics** tab while a workspace is paused — the most recent run's charts stay visible without resuming.
 Example: Workspace metrics
## Time range
Use the time range selector at the top of the charts to choose a window:
* **1h** (default), **6h**, **12h**, **1d**, **7d**
All charts update to reflect the selected time range.
## Display settings
Click the display settings control to customize the chart layout:
* **Grid mode** (default): Charts are arranged two per row for a compact overview
* **Expand mode**: Charts are shown one per row for detailed analysis
You can also toggle individual charts on or off. Your display preferences are saved to your browser.
## GPU utilization
Shows GPU compute usage over time as a percentage. Use this chart to check whether your GPU is actively processing workloads.
| Detail | Value |
| -------------- | ----------------------------------------------------- |
| Y-axis | 0–100% |
| Interpretation | Below **30%** can indicate over-provisioned resources |
## VRAM usage
Shows GPU video memory consumption over time. High VRAM usage can indicate risk of out-of-memory (OOM) errors.
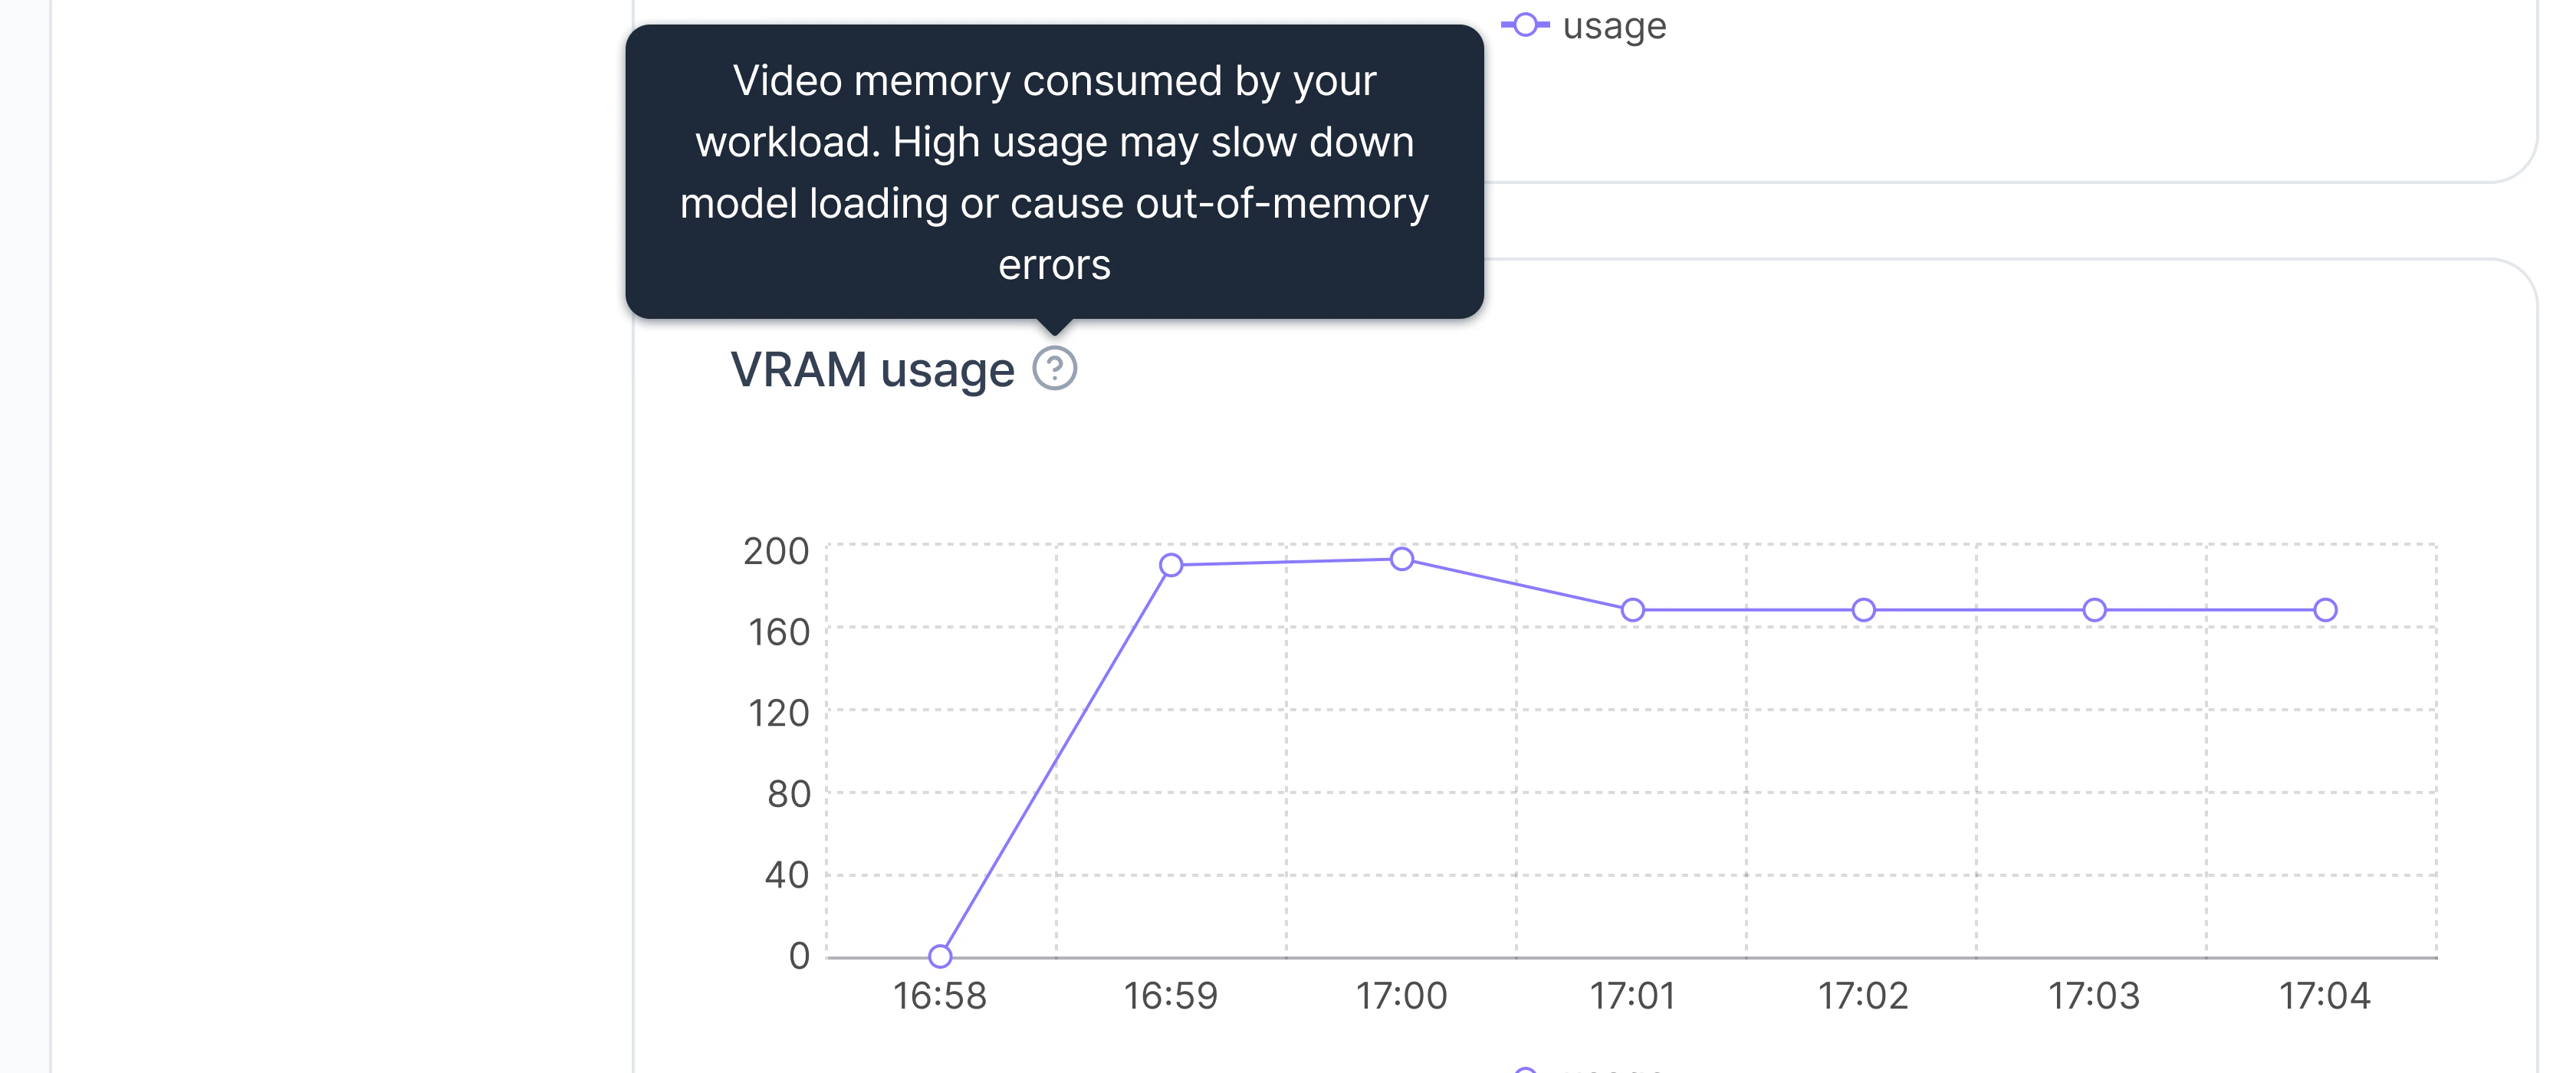 Example: VRAM usage chart
| Detail | Value |
| -------------- | ---------------------------------------------------------------------- |
| Y-axis | GB |
| Interpretation | High usage can slow model loading or increase out-of-memory (OOM) risk |
If VRAM usage consistently exceeds **95%**, your workload is at risk of OOM errors. Consider scaling up GPU memory via **Pause & Edit**.
## Temperature
Shows GPU temperature over time. Sustained high temperatures may trigger thermal throttling, reducing performance.
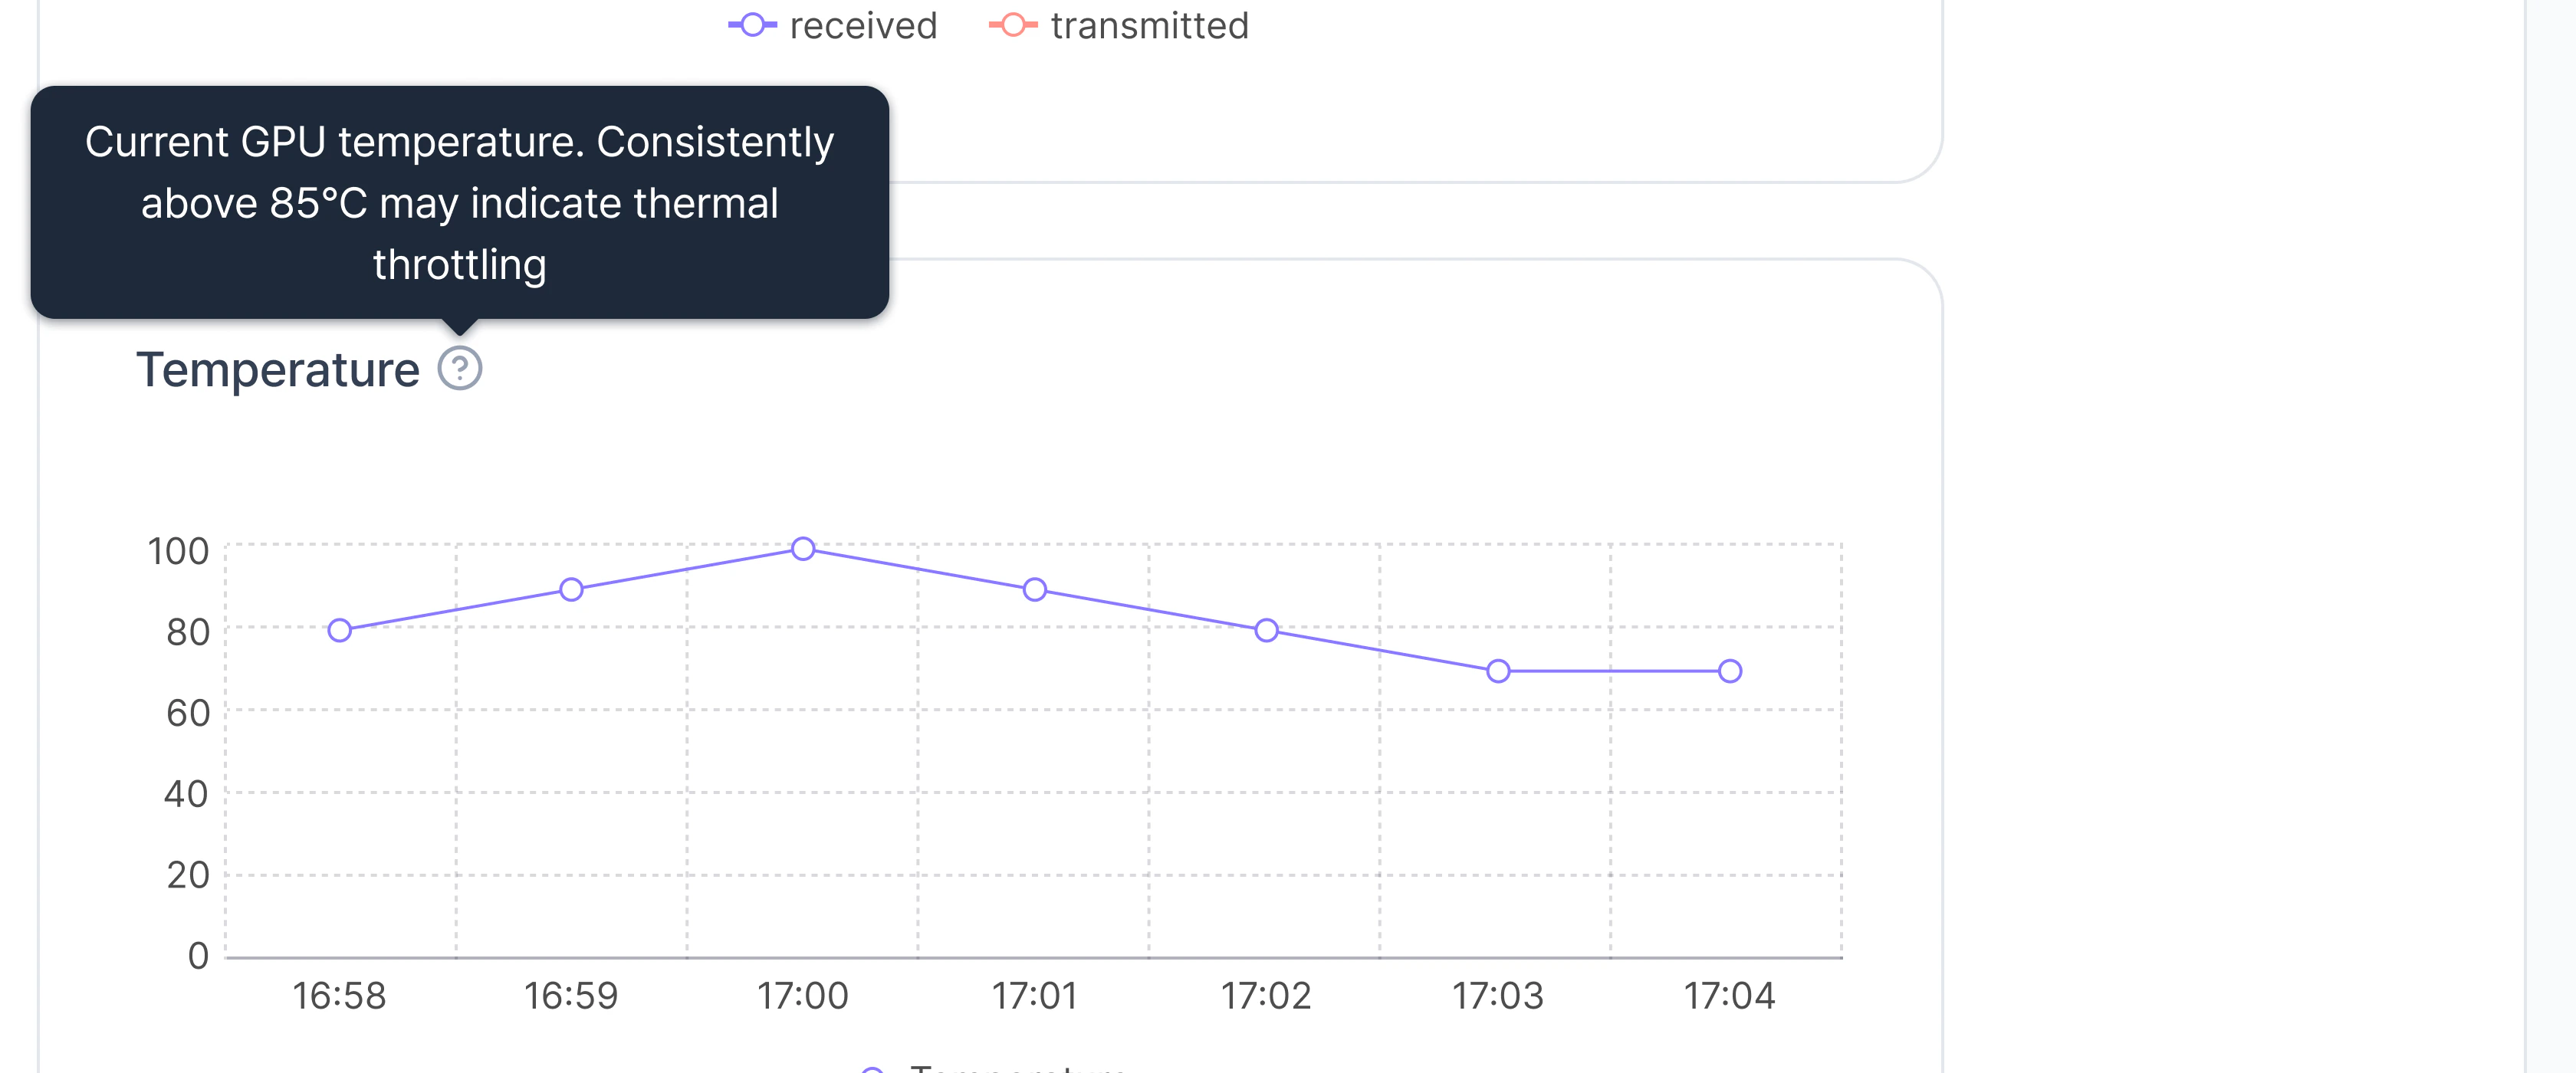 Example: Temperature chart
| Detail | Value |
| -------------- | ----------------------------------------------------------- |
| Y-axis | °C |
| Interpretation | Consistently above **85°C** can indicate thermal throttling |
## CPU and memory
* **CPU Utilization**: Percentage of allocated CPU cores in use.
* **Memory Usage**: System RAM consumed by the workspace.
## Network I/O
Shows data transferred in (Rx) and out (Tx) of the workspace over time.
## Storage
Storage metrics show current usage for volumes attached to the workspace:
* **Temporary storage**: Ephemeral storage included in the workspace. Data is cleared when the workspace stops or terminates
* **Cluster storage**: Persistent volumes mounted from Cluster storage (if attached)
* **Object storage**: S3-backed volumes mounted from Object storage (if attached)
## Under-utilization and high-utilization banners
When you navigate to this page from the [Home dashboard](../dashboard/overview) by clicking an under-utilized or high-utilization workload, a contextual banner appears at the top.
### Under-utilization banner
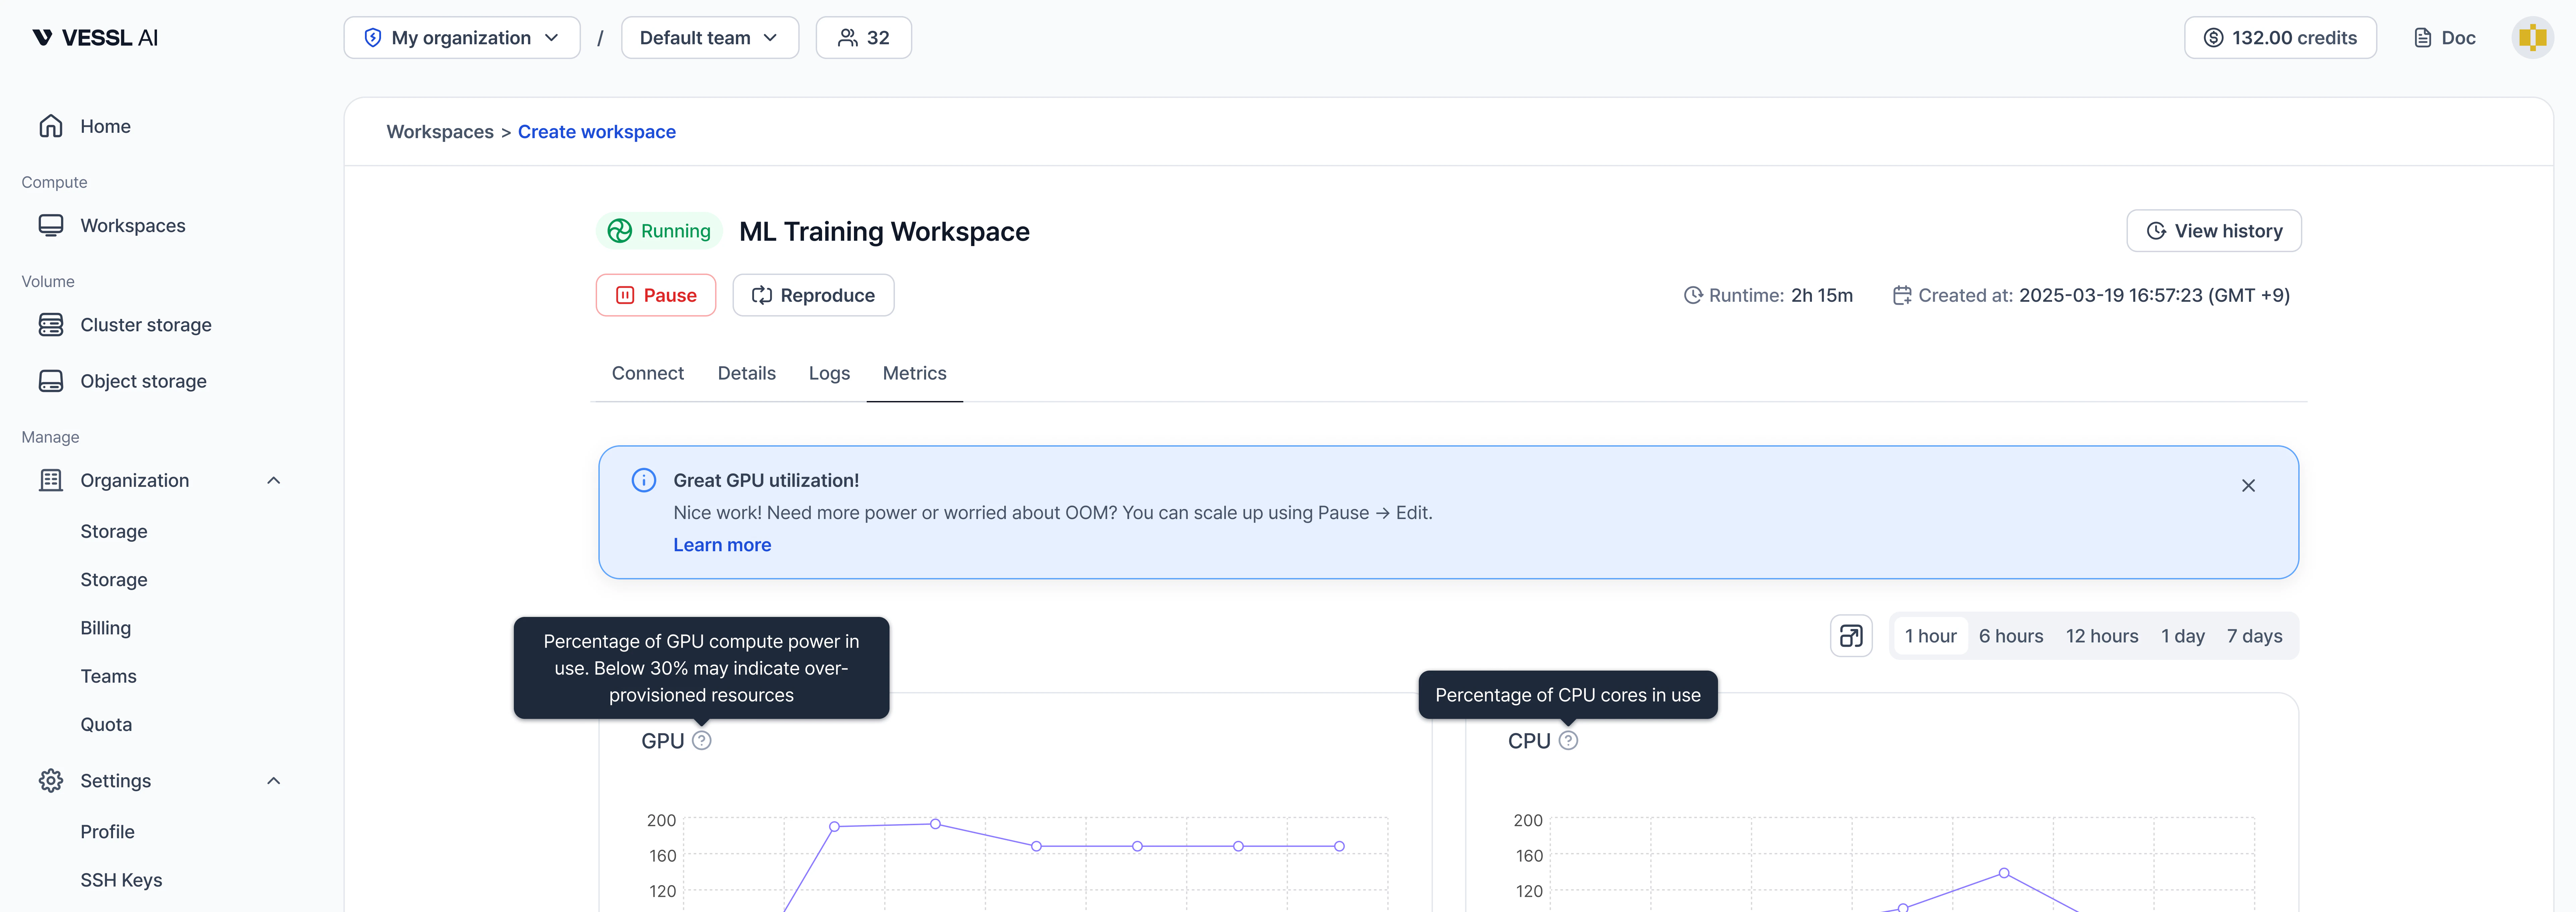 Example: Under-utilization banner
* **Condition**: GPU utilization below **30%** (one-hour average)
* **Banner context**: Recommends downscaling via **Pause & Edit** to reduce cost
* **Action**: Links to the Pause & Edit documentation
* **Dismiss**: The banner can be dismissed; it reappears after 24 hours if the condition persists
### High-utilization banner
* **Condition**: GPU utilization above **90%** (one-hour average)
* **Banner context**: Recommends scaling up via **Pause & Edit** when more compute or memory is needed
* **Action**: Links to the Pause & Edit documentation
**Threshold summary**: Under-utilization triggers below **30%** GPU utilization (one-hour average). High-utilization triggers above **90%**.