Once your API key is active, two places show your numbers: the Usage summary card on each model page, which defaults to the current month, and the Monitoring Dashboard, opened from Monitoring under Inference in the sidebar, which tracks token usage, performance, and reliability over a date range you pick.
Use the demo below to see how to open the Monitoring Dashboard from a model page and read the metrics under each tab.

Usage summary

This card sits on the model page. Use the month picker at the top of the card to move between billing months, and View details in Monitoring to open the Monitoring Dashboard.
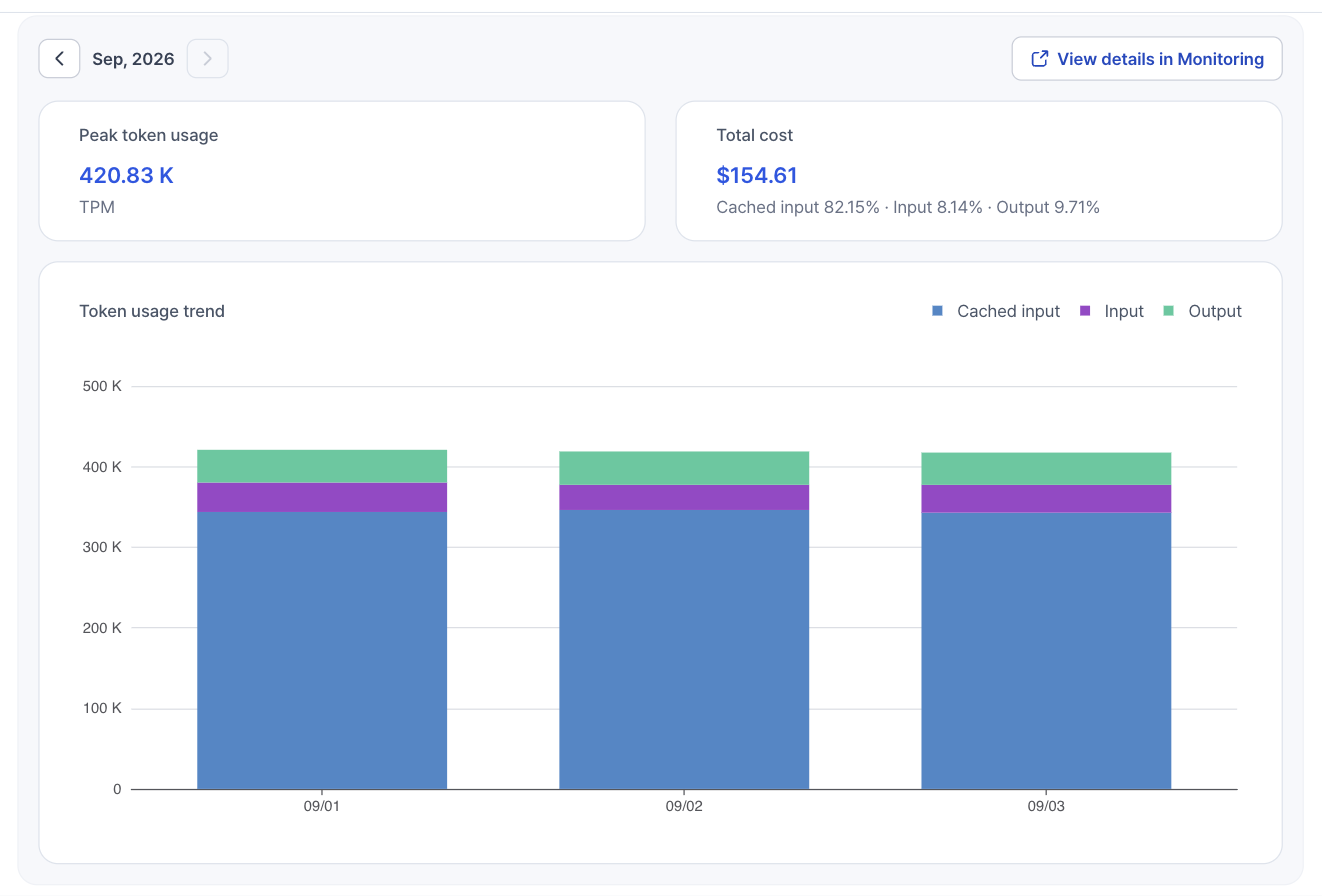
Usage summary card with the month picker, peak token usage in tokens per minute, total cost with the share of cached input, input, and output tokens, and the daily token usage trend chart

Monitoring Dashboard

Open InferenceMonitoring in the sidebar, or click View details in Monitoring on a model page. Pick a date range and one model or all of them, then read the metrics under three tabs.
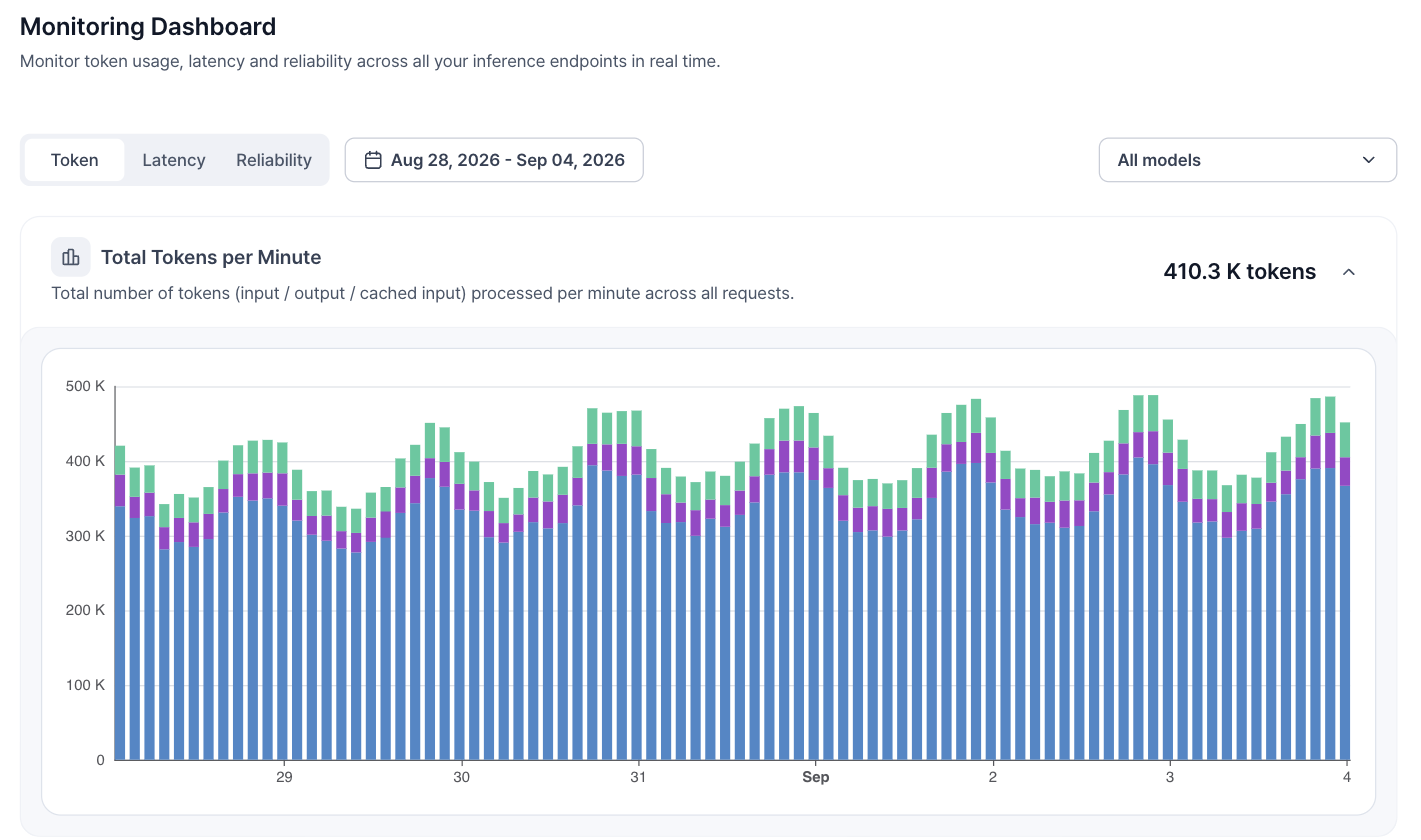
Monitoring Dashboard with the Token, Performance, and Reliability tabs, a date range picker, a model selector, and the Total Tokens per Minute chart

When you need more capacity

If Peak token usage is approaching the capacity your contracted PTUs guarantee, add PTUs: talk to sales or click Need more capacity? on the model page. See Manage your contract.